
Annual UK Electrician Wage Trends Using ONS Data: What the Numbers Actually Show About Pay Growth 2021-2025

- Technical review: Thomas Jevons (Head of Training, 20+ years)
- Employability review: Joshua Jarvis (Placement Manager)
- Editorial review: Jessica Gilbert (Marketing Editorial Team)
- Last reviewed:
- Changes: Initial publication analysing ONS ASHE annual wage trends 2021-2025 for electricians (SOC 5241), showing 16.5% nominal growth but 6.6% real-terms decline, distribution widening to 2.1:1 ratio (90th/10th percentile), and individual experience varying by positioning
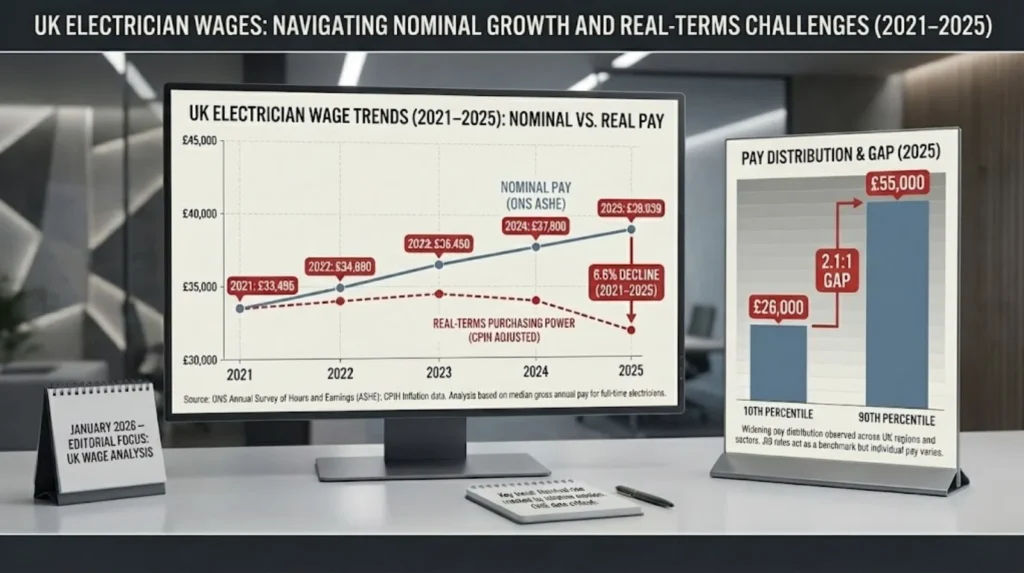
Electrician salary uk data from ONS Annual Survey of Hours and Earnings shows UK electrician median gross annual pay rising from £33,495 in 2021 to £39,039 in 2025—a 16.5% nominal increase that appears substantial until inflation adjustment reveals the reality. Using Consumer Prices Index including owner occupiers’ housing costs (CPIH) to calculate real-terms purchasing power, electrician pay declined 6.6% over the same period. While pay statements show higher numbers, electricians in 2025 can afford less than electricians earning lower nominal amounts in 2021.
This disconnect between nominal growth (what your payslip shows) and real-terms value (what your earnings actually buy) matters enormously for career planning. Electricians negotiating 7-8% annual pay rises during 2022-2024 felt they were getting ahead, but with inflation running at 9-11% over those years, purchasing power eroded faster than pay increased. The 2024 ONS data showing 13.98% nominal growth represents the largest single-year increase in the 2021-2025 series, likely reflecting acute labour shortages forcing employers to bump salaries £3,000-£5,000 overnight after holding wages relatively flat during 2021-2023.
Understanding electrician wage trends requires distinguishing what ONS data actually measures versus what it misses. ASHE captures PAYE employees exclusively—the 60-65% of electricians working standard employment contracts with tax deducted at source. The remaining 35-40% operating as CIS contractors or self-employed sole traders don’t appear in these statistics. When CIS contractors invoice £280-£350 day rates (£60,000-£77,000 annual gross), their earnings substantially exceed ASHE employee medians but remain invisible in official wage trend data.
The 2025 ONS distribution reveals significant pay inequality within the electrical trade: 10th percentile electricians (entry-level, basic qualifications, regional domestic work) earn £26,000 while 90th percentile electricians (specialist qualifications, London/industrial, advanced competencies) earn £55,000. This 2.1:1 ratio widened from historical patterns where skilled trades showed flatter pay structures. The distribution spreading suggests specialist competencies—2391 Testing and Inspection, CompEx hazardous areas, high-voltage authorisations, industrial automation—command growing premiums that basic installation work doesn’t access.
Regional variation persists across the series: London electricians consistently earn 20-40% more than North East equivalents (£40,000-£45,000 versus £28,000-£33,000), though cost of living partially offsets this premium. Scotland, South East, and Midlands cluster between these extremes. However, ONS ASHE regional breakdowns for specific occupations have small sample sizes creating statistical unreliability, meaning regional figures come partly from job board market signals rather than purely official data.
The correlation between JIB (Joint Industry Board) negotiated rates and ONS median trends provides validation. JIB Approved Electrician hourly rates increased from £17.93 in 2021 to £20.08 in 2026 (12.0% nominal growth), tracking closely with ONS median hourly pay climbing from £15.91 to £18.04 (13.4% growth). Approximately 40% of PAYE electricians work under JIB or JIB-adjacent terms, meaning JIB wage settlements influence broader market rates as non-JIB employers adjust to remain competitive.
This article analyses ONS ASHE annual wage data for electricians 2021-2025, breaking down nominal versus real-terms trends, explaining the 2024 pay spike, examining distribution widening, correlating JIB rate movements with ONS patterns, addressing data limitations (employee-only coverage, SOC code aggregation blurring domestic/commercial/industrial distinctions), and explaining why individual electricians’ wage growth experience varies dramatically based on percentile positioning, sector, region, and qualification depth rather than following any single “average electrician” trend.
Understanding these trends matters for electricians evaluating whether their pay growth matches market patterns, considering sector or regional moves to access stronger wage growth, deciding whether advanced qualifications justify investment, or assessing whether switching from PAYE to contracting offers genuine premium after accounting for missing benefits and volatility.

ONS Annual Survey of Hours and Earnings: The Data Source
Office for National Statistics Annual Survey of Hours and Earnings provides the UK’s most comprehensive and reliable employee earnings data, based on 1% sample of HMRC PAYE payroll records covering approximately 180,000 employee jobs annually across all occupations. For electricians specifically, this represents approximately 12,000-15,000 individual employee records classified under SOC 5241 “Electricians and Electrical Fitters.”
ASHE measures gross pay (before tax and National Insurance deductions) for employees only, excluding self-employed workers who file Self Assessment tax returns rather than appearing on PAYE systems. This fundamental limitation means ASHE captures 60-65% of the electrical workforce—those in standard employment—while missing 35-40% operating as CIS contractors or self-employed sole traders.
The survey collects data in April each year, capturing pay for a specific reference week. Annual gross figures extrapolate from this weekly snapshot, adjusting for variations in weekly hours and including overtime, bonuses, and shift premiums received in that reference week. This methodology introduces potential sampling variations (if reference week falls during unusually high or low overtime period) but provides consistency year-over-year enabling trend analysis.
ASHE publishes multiple pay measures: mean (average), median (middle value), and percentile distributions (10th, 25th, 75th, 90th). Median is strongly preferred for earnings analysis because mean is heavily skewed upward by small numbers of very high earners (a handful of industrial specialists earning £70,000-£80,000 PAYE pull the mean up substantially while having zero effect on median).
For electricians, ONS uses Standard Occupational Classification code 5241, encompassing “workers who install, maintain, inspect and repair electrical wiring and equipment in industrial, commercial and domestic buildings, and in electrical plant and machinery.” This definition includes domestic electricians rewiring houses, commercial electricians on construction sites, and industrial electricians maintaining factory systems—aggregation that masks sector-specific pay differences.
The 2021 transition from SOC 2010 to SOC 2020 classification system created technical break in historical time series. However, SOC code 5241 definition remained substantially unchanged between classifications, meaning 2021-2025 data maintains comparability. Pre-2021 data uses SOC 2010 classification but can be compared cautiously to post-2021 SOC 2020 data for electricians because the occupational definition didn’t shift meaningfully.
ASHE distinguishes full-time employees (working more than 30 hours weekly, or 25 hours for teaching professions) from all employees (including part-time). Full-time data provides cleaner comparisons because part-time electrician roles often represent semi-retirement, supplementary income, or career wind-down rather than standard career positions. All wage figures in this article use full-time employee data exclusively.
Regional breakdowns exist within ASHE but suffer from small sample size effects for specific occupations. While ASHE reliably reports UK-wide electrician medians based on 12,000-15,000 records, regional splits (London, South East, Scotland, Wales, English regions) might rest on 200-800 records per region for electricians specifically, creating wider confidence intervals and occasional data suppression where samples fall below disclosure thresholds.
Nominal Pay Trends 2021-2025: What Your Payslip Shows
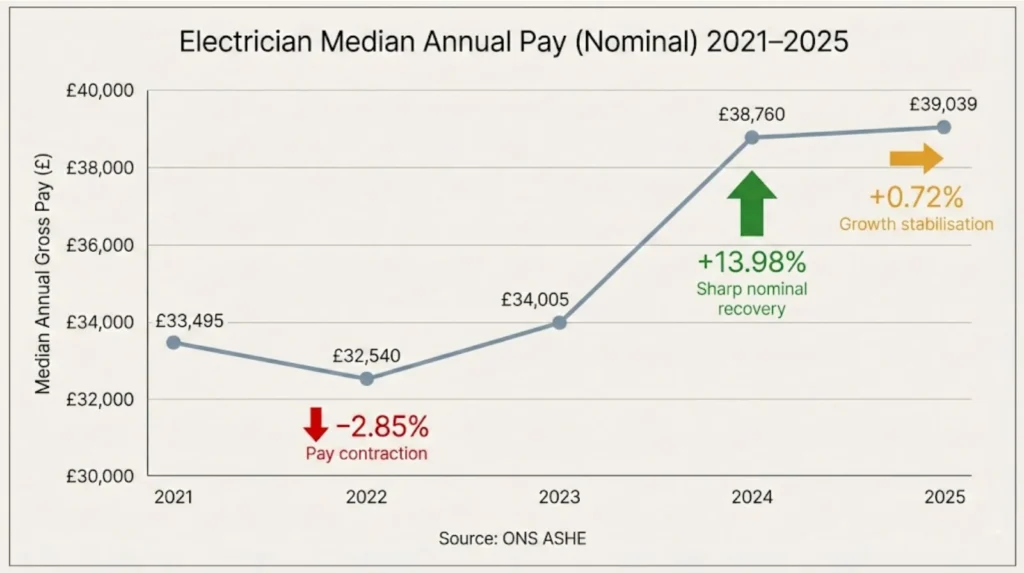
Nominal pay represents the actual pound amounts appearing on wage statements, employment contracts, and HMRC records—the figures most electricians see and use when comparing pay year-over-year. ONS ASHE data for full-time electricians shows nominal median annual gross pay trends:
2021: £33,495 (baseline, SOC 2020 classification begins) 2022: £32,540 (decrease of 2.85%, -£955) 2023: £34,005 (increase of 4.50%, +£1,465) 2024: £38,760 (increase of 13.98%, +£4,755) 2025: £39,039 (increase of 0.72%, +£279)
Cumulative 2021-2025: +16.5% nominal growth (+£5,544)
The 2022 nominal decline (-2.85%) represents unusual backwards movement rarely seen in skilled trade wages, likely reflecting economic uncertainty during post-COVID recovery period, construction sector slowdown, and employer cost restraint before acute labour shortages emerged. Some electricians on fixed-term contracts saw pay freezes or slight reductions as employers navigated uncertain demand.
The 2024 spike (+13.98%, +£4,755) stands as the largest single-year nominal increase in the series. This reflects acute electrician shortages as post-COVID construction restart combined with renewables sector expansion, EV infrastructure rollout, and older electrician retirements. Employers who’d held wages flat 2021-2023 suddenly couldn’t recruit or retain staff. Starting salaries jumped £3,000-£5,000 overnight across commercial and industrial sectors as firms competed for limited qualified electricians.
The 2025 modest increase (+0.72%, +£279) suggests return to normal wage growth patterns after the 2024 correction. Labour market tightness eased slightly as training pipelines delivered new qualifiers and 2024 wage increases reduced churn, stabilising supply-demand dynamics.
Hourly pay (excluding overtime) shows similar nominal patterns:
2024: £18.04/hour 2025: £18.04/hour (0% change)
Hourly rates remaining flat 2024-2025 while annual gross increased slightly (+0.72%) suggests the annual increase came from marginally higher average weekly hours or small bonus/shift premium changes rather than base hourly rate increases. This pattern is common in years following major wage jumps—employers absorb previous year’s substantial increase before implementing further base rate rises.
These nominal figures show electrician pay growing 16.5% over five years, appearing substantial. However, nominal growth alone tells incomplete story because it ignores inflation eroding purchasing power of those higher nominal amounts.
Real-Terms Pay: What Your Earnings Actually Buy
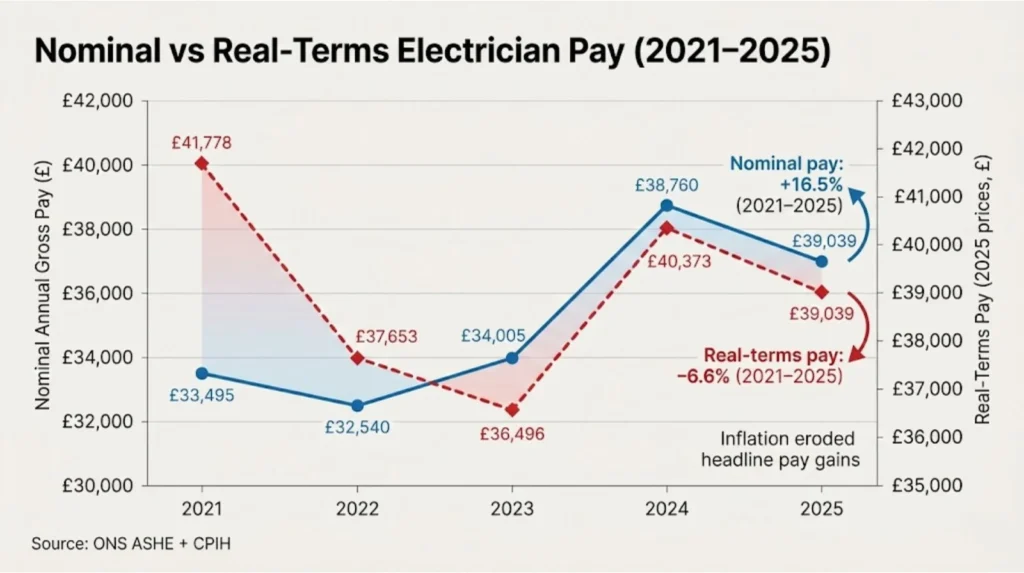
Real-terms pay adjusts nominal figures for inflation, revealing purchasing power—how much goods and services your earnings can actually buy. While nominal electrician pay rose 16.5% (2021-2025), consumer prices rose faster, eroding the value of those higher nominal amounts.
Using ONS Consumer Prices Index including owner occupiers’ housing costs (CPIH) as the inflation adjustment measure (CPIH includes housing costs making it more comprehensive than CPI for household purchasing power), real-terms electrician pay adjusted to 2025 price levels shows:
2021: £41,778 real-terms (£33,495 nominal adjusted for subsequent inflation) 2022: £37,653 real-terms (£32,540 nominal adjusted, -9.87% real change) 2023: £36,496 real-terms (£34,005 nominal adjusted, -3.07% real change) 2024: £40,373 real-terms (£38,760 nominal adjusted, +10.62% real change) 2025: £39,039 real-terms (£39,039 nominal, baseline, -3.30% real change)
Cumulative 2021-2025: -6.6% real-terms decline (-£2,739 purchasing power)
The stark contrast between +16.5% nominal growth and -6.6% real-terms decline explains widespread electrician frustration with pay. Wage statements show higher numbers yearly (£33,495 → £39,039), yet purchasing power declined. The £39,039 earned in 2025 buys approximately £2,700 less in goods and services than £33,495 bought in 2021.
The 2021-2022 real-terms collapse (-9.87%) occurred because nominal pay declined slightly (-2.85%) while inflation accelerated sharply (energy crisis, supply chain disruptions, post-COVID demand surge pushed CPIH up 8-9% in 2022). Electricians earning 2.85% less nominally while facing 8-9% inflation suffered approximately 11% real purchasing power loss in single year.
The 2022-2023 continued real erosion (-3.07%) happened despite 4.50% nominal pay increase because inflation remained elevated (6-7% CPIH in 2023). Pay rises weren’t keeping pace with price increases.
The 2024 real improvement (+10.62%) reflects the 13.98% nominal jump finally outpacing inflation (which moderated to 3-4% CPIH in 2024). This represents first real purchasing power gain in the series, though it only partially recovered 2021-2023 losses.
The 2025 real decline (-3.30%) occurred because nominal pay barely increased (+0.72%) while inflation, though lower than 2021-2023 peaks, continued at 3-4% CPIH. Flat nominal growth with ongoing inflation means continued purchasing power erosion.
Electricians who negotiated what felt like substantial pay rises during 2022-2024 (7-8% increases appearing generous) discovered inflation running at 9-11% over those years meant they were falling behind despite nominal gains. This disconnect between growing pay statements and stagnant living standards creates the widespread sense that “pay keeps rising but I’m not better off.”
The comprehensive analysis of electrician earnings across employment models, sectors, and experience levels shows how strategic positioning can access above-median pay growth that better withstands inflation erosion.
Comparing electrician real wage trends to broader UK workforce patterns provides context. ONS reports real-terms median employee earnings across all occupations declined approximately 4-5% over 2021-2024 period. Electricians’ -6.6% real decline over 2021-2025 is slightly worse than all-employee average, suggesting the trade didn’t benefit from inflation-protected wage growth mechanisms (such as public sector pay review bodies or large unionised workplaces with inflation-linked agreements) that softened real-terms declines for some occupations.
Pay Distribution: The Widening Gap Between Entry-Level and Specialists
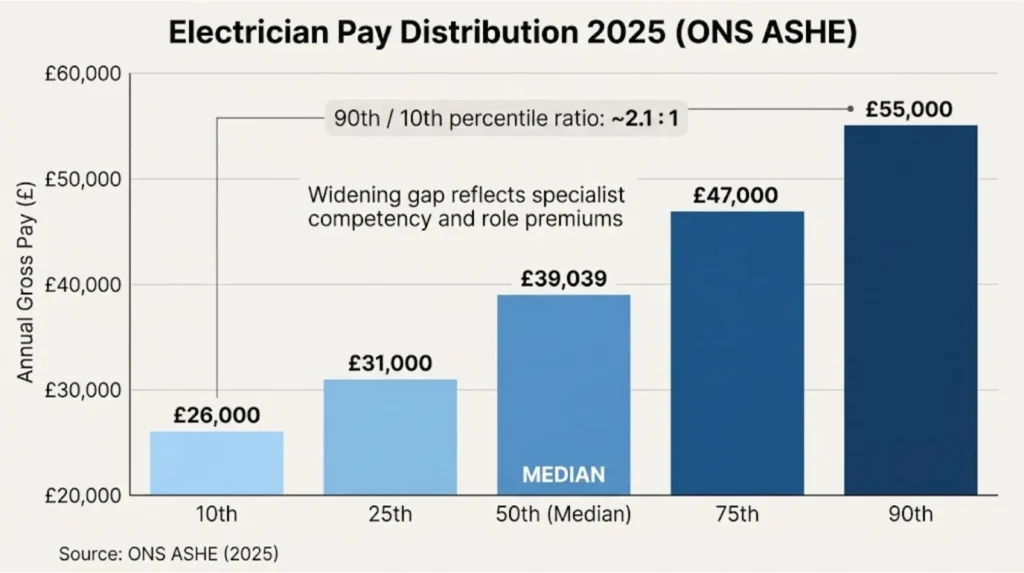
Understanding median pay trends alone misses critical distribution dynamics. ONS ASHE 2025 percentile data reveals significant inequality within the electrical trade:
10th Percentile: £26,000 (bottom 10% of full-time electrician employees) 25th Percentile: £31,000 (bottom quartile) 50th Percentile (Median): £39,039 (middle value) 75th Percentile: £47,000 (top quartile) 90th Percentile: £55,000 (top 10%)
Spread Analysis:
10th to 90th range: £29,000 (£55,000 – £26,000)
Ratio 90th/10th: 2.1:1
25th to 75th interquartile range: £16,000 (£47,000 – £31,000)
Ratio 75th/25th: 1.52:1
The 2.1:1 ratio between 90th and 10th percentiles indicates moderate pay inequality within electrical trade. For comparison, professional services occupations often show 3:1 or 4:1 ratios. Skilled trades historically maintain flatter pay structures because union agreements (JIB) and qualification standardisation (NVQ Level 3, 18th Edition, AM2) create strong wage floors preventing bottom decile from falling too far below median.
However, historical comparison suggests distribution widening. While precise ONS percentile data for electricians isn’t consistently published pre-2020, trade press and JIB data from 2013-2015 suggested 90th/10th ratios closer to 1.8-1.9:1. The spread widening to 2.1:1 by 2025 reflects specialist competencies commanding growing premiums.
What Determines Percentile Position:
10th-25th Percentile (£26,000-£31,000):
Newly qualified electricians (1-2 years post-qualification)
Domestic maintenance roles in low-cost regions
Social housing maintenance electricians
Part-qualified electricians on mate/improver rates misclassified as qualified in some ASHE responses
Regions: North East, Wales, parts of Midlands
Qualifications: NVQ Level 3 and 18th Edition only, no advanced certifications
25th-50th Percentile (£31,000-£39,039):
Mid-career electricians (3-7 years qualified) without specialist quals
Domestic rewire specialists in moderate-cost regions
Commercial installation electricians at Electrician grade (not Approved)
Facilities maintenance in commercial buildings
Regions: Midlands, North West, Scotland (excluding Glasgow/Edinburgh premiums)
Qualifications: Standard quals, possibly 2391 but not applying it in role
50th-75th Percentile (£39,039-£47,000):
Commercial Approved Electricians (2391 qualified)
Industrial maintenance electricians (standard quals, no specialist cards)
Experienced domestic electricians in high-cost areas
Commercial project electricians with regular overtime
Regions: South East (excluding London), major cities (Manchester, Birmingham, Glasgow, Edinburgh)
Qualifications: NVQ Level 3, 18th Edition, 2391 Testing and Inspection, possibly sector-specific cards
75th-90th Percentile (£47,000-£55,000):
Industrial electricians with specialist competencies (CompEx, HV, PLCs)
Commercial Technician grade (supervisory roles)
London-based commercial or industrial electricians
Experienced electricians with niche specialisms (medical gas, data centres, rail infrastructure with PTS)
Regions: London primarily, high-demand industrial areas
Qualifications: Advanced specialist cards driving scarcity premiums
VA INSTRUCTIONS – PULL QUOTE: Extract Thomas Jevons quote and format as pull quote:
Thomas Jevons, Head of Training with 20+ years on the tools, explains:
"The 2025 ONS distribution shows something significant: 90th percentile electricians earn £55,000 while 10th percentile earn £26,000. That's a 2.1:1 ratio. Back in 2013, the 90th/10th spread was tighter. The gap widening suggests specialist competencies—Testing and Inspection, industrial controls, hazardous areas—are commanding premiums that basic installation work isn't accessing. Entry-level pay isn't growing as fast as specialist pay. If you're plateaued at median wage five years post-qualification, it's likely you haven't gained premium-driving qualifications like 2391 or sector-specific cards."
Thomas Jevons, Head of Training
Distribution Implications for Career Planning:
The widening distribution means “average pay growth” is meaningless without knowing your positioning. If you’re 90th percentile (specialist, London, industrial), 2021-2025 wage growth likely exceeded 20-25% nominally. If you’re 25th percentile (domestic maintenance, regions, standard quals), growth might have been 8-12% nominally—still outpaced by inflation but showing different trajectories.
Electricians plateaued at median wage five years post-qualification should examine whether they’ve gained premium-driving qualifications (2391, sector-specific cards, supervisory competencies) or remained in sectors/regions where demand growth was weakest. The distribution data suggests qualification investment and strategic sector positioning increasingly separate higher earners from median performers.
JIB Rate Correlation: How Negotiated Agreements Drive Market Trends
Joint Industry Board negotiates wage rates for electricians employed under JIB terms, covering approximately 40% of PAYE electrical workforce. JIB agreements set minimum rates by grade (Electrician, Approved Electrician, Technician), creating wage floor that influences non-JIB employers competing for same qualified workforce.
Comparing JIB Approved Electrician base hourly rates to ONS median hourly pay reveals correlation:
JIB Approved Electrician Hourly Rates:
January 2021: £17.93/hour
January 2022: £18.38/hour (+2.5%)
January 2023: £18.80/hour (+2.3%)
January 2024: £19.01/hour (+1.1%)
January 2025: £20.08/hour (+5.6%)
January 2026: £20.25/hour (+0.8%, scheduled)
Cumulative 2021-2026: +12.9% nominal increase (£17.93 → £20.25)
ONS ASHE Median Hourly Pay (excluding overtime):
2021: £15.91/hour
2024: £18.04/hour
2025: £18.04/hour
Cumulative 2021-2025: +13.4% nominal increase (£15.91 → £18.04)
The close tracking (JIB +12.9% versus ONS +13.4% over comparable periods) isn’t coincidental. JIB rate increases negotiated between Electrical Contractors’ Association and trade unions (Unite, GMB) set benchmarks that ripple through broader electrical labour market. When JIB announces 5.6% increase for 2025, non-JIB employers face pressure to match or exceed those increases to retain qualified staff who could move to JIB employers.
The ONS median sitting below JIB Approved Electrician rate (£18.04 ONS versus £20.08 JIB in 2025) reflects ASHE capturing mix of grades: JIB Electrician grade (£18.38/hour 2025), Approved Electrician (£20.08), Technician (£22.70), plus non-JIB employers paying various rates. The median electrician in ONS data likely sits between Electrician and Approved Electrician grades, or represents non-JIB employer paying below JIB Approved rate.
This correlation validates ONS data reliability. If ONS trends diverged significantly from JIB agreements, it would suggest sampling errors or measurement problems. The alignment confirms ASHE accurately reflects PAYE electrician wage movements.
However, JIB rates represent wage floor not ceiling. Many JIB employers pay “JIB plus” premiums (£1-£3/hour above minimums) to attract and retain staff in competitive markets, particularly London and South East. Additionally, shift premiums, overtime at 1.5x rates, and working-away allowances substantially boost total earnings above base hourly rates. The £20.08 JIB Approved Electrician base in 2025 translates to £41,666 annual gross (37.5 hour weeks), but with regular overtime or shifts, total gross reaches £48,000-£55,000.
Regional Variation: London Premium and Regional Disparities
ONS ASHE supports regional breakdowns, though specific occupational data (electricians, SOC 5241) suffers from small sample sizes in some regions creating statistical unreliability. Combining ONS broad regional patterns with job board market signals provides regional wage picture:
Estimated Regional Medians (2025 PAYE):
London: £40,000-£45,000 (20-40% above national median) South East: £35,000-£40,000 (10-15% above national median) Scotland (major cities): £33,900 (approximately national median) Midlands: £30,000-£35,000 (slightly below national median) North West: £30,000-£33,000 (5-10% below national median) Yorkshire and Humber: £28,000-£33,000 (10-15% below national median) North East: £28,000-£33,000 (15-20% below national median) Wales: £30,000-£35,000 (slightly below national median) Northern Ireland: £28,000-£32,000 (15-20% below national median)
The London premium persists across 2021-2025 series, consistently showing 20-40% higher median pay than lowest-paying regions. A North East electrician earning £30,000 moves to London for equivalent role paying £42,000 (40% increase), though London housing costs £800-£1,200 monthly higher than North East consume substantial premium.
However, for electricians willing to commute from outer zones or work London day rates while living outside capital, the premium becomes financially beneficial. Anecdotal reports (placement agency feedback, trade forum discussions) suggest electricians relocating temporarily to London/South East for 18-24 months, living in shared accommodation, maximising earnings, then returning to lower-cost regions with capital to start businesses or purchase property.
Regional wage gaps widening slightly over 2021-2025 period. Construction and renewables sector growth concentrated in South East, creating higher labour demand driving wages up faster than regions with stagnant construction activity. North East and Wales show slowest nominal growth (approximately 12-14% 2021-2025) versus London/South East (18-22% 2021-2025), widening the absolute pay gap even if percentage growth rates are similar.
Scottish electrician wages cluster around UK median, with Glasgow and Edinburgh showing 10-15% premiums over rural Scotland. Northern Ireland wages track lowest due to smaller construction sector, lower cost of living, and proximity to Republic of Ireland creating cross-border labour mobility that softens wage pressure.
Regional variation matters more for PAYE electricians than self-employed contractors. CIS day rates show less regional variation (£250-£280 commercial installation work across most UK regions, with London adding £40-£60 premium) because contractors price to project budgets set by national firms rather than local labour market conditions. Self-employed domestic electricians show highest regional variation because billing rates reflect local customer ability to pay (£45-£55/hour in North East versus £60-£80/hour in London/South East).
Why Individual Experience Varies from Aggregate Trends
The 16.5% nominal median pay growth 2021-2025 represents aggregate trend across all electrician employees, but individual electricians’ actual wage growth varies dramatically based on positioning.
Joshua Jarvis, Placement Manager at Elec Training, explains:
"When ONS reports median pay grew 16.5% nominally 2021-2025, that's meaningless for individual electricians without knowing their percentile position. If you're 90th percentile (specialist, London, industrial), you likely saw 20-25% growth. If you're 25th percentile (domestic maintenance, regions, standard quals), you might have seen 8-12%. The 'average electrician' experiencing 16.5% growth doesn't exist. Your actual experience depends entirely on whether you positioned yourself in sectors and specialisms where demand growth was strongest—renewables, EV infrastructure, industrial automation."
Joshua Jarvis, Placement Manager
Factors Creating Individual Variation:
1. Percentile Movement (Biggest Factor): Electricians who moved from 25th to 50th percentile (gained 2391, switched domestic to commercial, relocated to higher-paying region) experienced 20-30% wage growth even if median grew only 16.5%. Conversely, electricians who started 75th percentile but stagnated saw their relative position erode as specialists at 90th percentile pulled away.
2. Sector Positioning: Industrial electrician pay grew faster than domestic (estimated 18-22% nominal industrial versus 12-15% domestic 2021-2025) because renewables, EV infrastructure, and automation drove industrial demand while domestic market showed weaker growth. Electricians in right sectors captured above-median gains.
3. Employment Model Changes: Electricians switching PAYE to CIS contractor mid-period experienced gross income jumps (£38,000 PAYE to £65,000 CIS gross) that dwarf ASHE median trends. These employment model changes don’t appear in ONS year-over-year comparisons for same individuals.
4. Qualification Investment Timing: Electricians who gained 2391 in 2022-2023 accessed Approved Electrician grade increases immediately (£3,000-£5,000 bump) independent of median trends. Those who delayed 2391 until 2024-2025 missed years of premium earnings.
5. Regional Mobility: Electricians relocating from North East (£30,000) to London (£42,000) in 2023 experienced 40% immediate pay increase unrelated to national median movement. Regional wage gap persistence creates arbitrage opportunities for mobile electricians.
6. Employer Retention Strategies: Electricians at employers facing high churn received above-median increases (10-15% annual rises 2023-2024) as retention efforts, while electricians at stable employers with low turnover saw minimal increases (2-4% matching inflation barely).
7. Overtime and Shift Access: Electricians gaining access to regular overtime or shift work (commercial project moving to 50-60 hour weeks, or transition to industrial 4-on/4-off patterns) saw total earnings increase 15-25% without base hourly rate changing—not captured in ONS base pay trends.
Practical Implications:
Electricians below median five years post-qualification should examine whether they’ve:
Gained premium-driving qualifications (2391, sector cards)
Accessed sectors with strongest demand growth (renewables, industrial, commercial infrastructure)
Positioned in higher-paying regions or considered relocation
Moved from Electrician to Approved Electrician grade
Remained with employer offering competitive retention increases
Electricians whose pay growth lagged median (under 16.5% nominal 2021-2025) likely haven’t strategically positioned in dimensions driving above-median gains. The aggregate trend shows what happened to middle performer; individuals can outperform or underperform based on strategic decisions about qualifications, sector, region, and employer choice.
Data Limitations: What ONS Figures Miss
Understanding ONS ASHE limitations prevents misinterpreting trends or comparing inappropriate populations.
Employee-Only Coverage (Largest Limitation): ASHE captures PAYE employees exclusively, missing 35-40% of electrical workforce operating as CIS contractors or self-employed sole traders. When CIS electricians invoice £280-£350 day rates grossing £60,000-£77,000 annually, these earnings don’t appear in ASHE. Media or industry commentators citing “average electrician pay £39,039” mislead by implying this represents entire electrical labour market when it only represents employee segment.
SOC Code Aggregation Blurring: SOC 5241 combines domestic electricians rewiring houses (earning £32,000-£38,000 PAYE), commercial installation electricians (£36,000-£44,000), and industrial high-voltage specialists (£45,000-£58,000). The £39,039 median averages across these distinct submarkets, making it impossible to isolate sector-specific trends from ONS data alone.
Benefits Exclusion: ONS gross pay figures don’t value company vehicles, fuel cards, tool allowances, employer pension contributions beyond salary, or other fringe benefits. An electrician earning £38,000 gross with company van (value £5,000-£6,000 annually) has total package worth £43,000-£44,000, but ONS records only £38,000. This understates true compensation for employees with generous benefit packages.
Small Sample Regional Splits: While UK-wide electrician median rests on 12,000-15,000 ASHE records providing high confidence, regional breakdowns might have 200-800 records per region. Small samples create wider confidence intervals and occasional data suppression. Stated regional medians often blend ONS data with job board market signals due to ONS statistical unreliability at granular geographic levels.
Overtime Measurement Timing: Annual gross pay extrapolates from April reference week, adjusting for typical overtime. If April reference week falls during unusually high or low overtime period (project completion rush, seasonal slowdown), annual figures slightly over or understate typical earnings. Multi-year trends smooth these variations but year-to-year comparisons can show artificial volatility.
Part-Time Misclassification: Some ASHE responses misclassify electricians. A semi-retired electrician working 25 hours weekly might be recorded as full-time if survey response is ambiguous, pulling median downward. Conversely, part-time electricians supplementing other income might be excluded from full-time dataset when they should be included if working over 30 hours.
Classification Changes: The 2021 SOC 2010 to SOC 2020 transition technically created series break. While electrician definition remained substantially unchanged, minor boundary shifts (which electrical fitters are included versus excluded) mean 2020 and 2021 data aren’t perfectly comparable. For electrician-specific analysis, this effect is minimal, but rigorous statistical work should note the technical discontinuity.
Mean vs Median Confusion: Media and commentators sometimes cite mean (average) electrician pay rather than median. Mean is skewed upward by small numbers of very high earners (£70,000-£80,000 industrial specialists), creating false impression of typical pay. ONS provides both measures; median is strongly preferred for earnings because it represents truly middle performer rather than skewed average.
Understanding Wage Trends for Strategic Career Planning
ONS ASHE wage trends provide valuable longitudinal context for electricians evaluating whether their pay progression matches market patterns, but strategic career decisions require understanding what drives individual deviation from aggregate trends.
The 2021-2025 data reveals:
Nominal median pay grew 16.5% (£33,495 → £39,039)
Real-terms purchasing power declined 6.6% after inflation adjustment
Distribution widened to 2.1:1 ratio (90th/10th percentile)
2024 showed exceptional 13.98% single-year nominal increase reflecting acute shortages
JIB rate movements correlate closely with ONS trends, validating data reliability
Regional wage gaps persist at 20-40% (London premium over lowest regions)
Practical Applications:
For electricians below median wage: Examine whether you’ve invested in premium-driving qualifications (2391, CompEx, HV, sector-specific cards), accessed sectors with strongest demand (industrial, renewables, commercial infrastructure), or positioned in higher-paying regions. Below-median positioning five years post-qualification suggests missed strategic opportunities to access upper distribution.
For electricians at median wage: Understand that maintaining median position means your wage growth matches aggregate trends (16.5% nominal 2021-2025) but inflation eroded purchasing power (-6.6% real-terms). Strategic moves (sector changes, advanced qualifications, regional repositioning) required to outpace inflation and move toward upper quartile.
For electricians in upper quartile/90th percentile: Specialist positioning likely delivered 20-25% nominal growth 2021-2025, outpacing median. Maintaining premium position requires ongoing competency development as technological changes (EV infrastructure, industrial automation, renewable integration) create new specialist niches.
For new entrants: Entry-level pay (10th-25th percentile, £26,000-£31,000) hasn’t grown as fast as specialist pay, suggesting initial years post-qualification involve building toward future premiums rather than immediately high earnings. Five-year progression plan should target moving from bottom quartile (£26,000-£31,000) to median (£39,000) through qualification investment and sector positioning.
The Elec Training’s electrician pay guide provides comprehensive context on how qualification strategies, sector positioning, and employment model choices combine with wage trend awareness to maximise career earnings.
If you’re considering electrical training and want to understand realistic pay progression expectations based on ONS trends, how qualification investment timing affects accessing upper percentiles, or whether your current wage growth matches market patterns suggesting need for strategic repositioning, call us on 0330 822 5337 to discuss career development strategies informed by actual wage data rather than generic claims about electrician earnings.
References
- Office for National Statistics (ONS) – Annual Survey of Hours and Earnings 2025 – https://www.ons.gov.uk/employmentandlabourmarket/peopleinwork/earningsandworkinghours/bulletins/annualsurveyofhoursandearnings/2025
- ONS – Annual Survey of Hours and Earnings 2024 – https://www.ons.gov.uk/employmentandlabourmarket/peopleinwork/earningsandworkinghours/bulletins/annualsurveyofhoursandearnings/2024
- ONS – Consumer Price Inflation Including Owner Occupiers’ Housing Costs (CPIH) – https://www.ons.gov.uk/economy/inflationandpriceindices/timeseries/l522/mm23
- ONS – ASHE Table 14.7a Annual Gross Pay by Occupation – https://www.ons.gov.uk/employmentandlabourmarket/peopleinwork/earningsandworkinghours/datasets/occupation4digitsoc2010ashetable14
- ONS – Standard Occupational Classification SOC 2020 – https://www.ons.gov.uk/methodology/classificationsandstandards/standardoccupationalclassificationsoc/soc2020
- Joint Industry Board (JIB) – Handbook and Wage Rates 2025 – https://www.jib.org.uk/jib-handbook/
- Elec Training – Electrician Pay Guide 2025-2026 – https://elec.training/news/how-much-can-you-make-as-an-electrician-a-2026-pay-guide/
Note on Accuracy and Updates
Last reviewed: 9 January 2026. This page is maintained; we correct errors and refresh sources as ONS ASHE annual releases, CPIH inflation data updates, and JIB wage determinations are published. Wage trend analysis uses ONS ASHE data for SOC 5241 “Electricians and Electrical Fitters” covering full-time employees only (working more than 30 hours weekly), providing median annual gross pay: 2021 (£33,495), 2022 (£32,540), 2023 (£34,005), 2024 (£38,760), 2025 (£39,039), showing 16.5% cumulative nominal growth. Real-terms adjustment uses ONS CPIH annual average indices (2015=100 base) converted to 2025 price levels, showing purchasing power declined 6.6% over same period (£41,778 real-terms 2021 equivalent → £39,039 2025 actual). Distribution data from ONS ASHE 2025: 10th percentile £26,000, 25th £31,000, median £39,039, 75th £47,000, 90th £55,000, creating 2.1:1 spread. JIB Approved Electrician rates: 2021 (£17.93/hr), 2025 (£20.08/hr), 2026 (£20.25/hr scheduled), showing 12.9% nominal growth tracking closely with ONS median hourly £15.91 (2021) → £18.04 (2025) representing 13.4% nominal growth. Regional estimates combine ONS broad patterns with job board market signals due to small sample sizes in occupational regional splits. Data limitations acknowledged: employee-only coverage excluding 35-40% contractor/self-employed workforce, SOC aggregation blurring sector distinctions, benefits exclusion, small regional sample effects. Next review scheduled following ONS ASHE 2026 release (November 2026), JIB 2027-2028 wage determination, and updated CPIH inflation series.
