
Electrician Wage Growth Predictions: 2026-2030 | What the Data Actually Suggests

- Technical review: Thomas Jevons (Head of Training, 20+ years)
- Employability review: Joshua Jarvis (Placement Manager)
- Editorial review: Jessica Gilbert (Marketing Editorial Team)
- Last reviewed:
- Changes: Initial publication analyzing electrician wage growth projections 2026-2030, showing most likely 3-6% nominal annual growth (16-34% cumulative) with 1-4% real growth after inflation, three-scenario framework (low 2-4%, base 4-5%, high 5-6%), specialist certification premium widening (HV/CompEx 7-10% vs domestic 3-5%), employer switching strategy delivering 8.2% annually vs staying 4.9%
Predicting how much do electricians make over the 2026-2030 period requires examining historical wage trends (ONS ASHE showing 3-4% nominal annual growth 2016-2024), macroeconomic forecasts (OBR projecting 3% UK average earnings growth with 2% inflation baseline), sector-specific demand drivers (grid upgrades, data centres, electrification creating acute shortages), and supply constraints (training pipeline producing 7,500 newly qualified annually versus projected need for 10,000-12,000). The most defensible projection suggests nominal wage growth of 3-6% annually leading to cumulative increases of 16-34% by 2030, with real wage growth (inflation-adjusted purchasing power) of 1-4% annually representing 5-22% cumulative improvement.
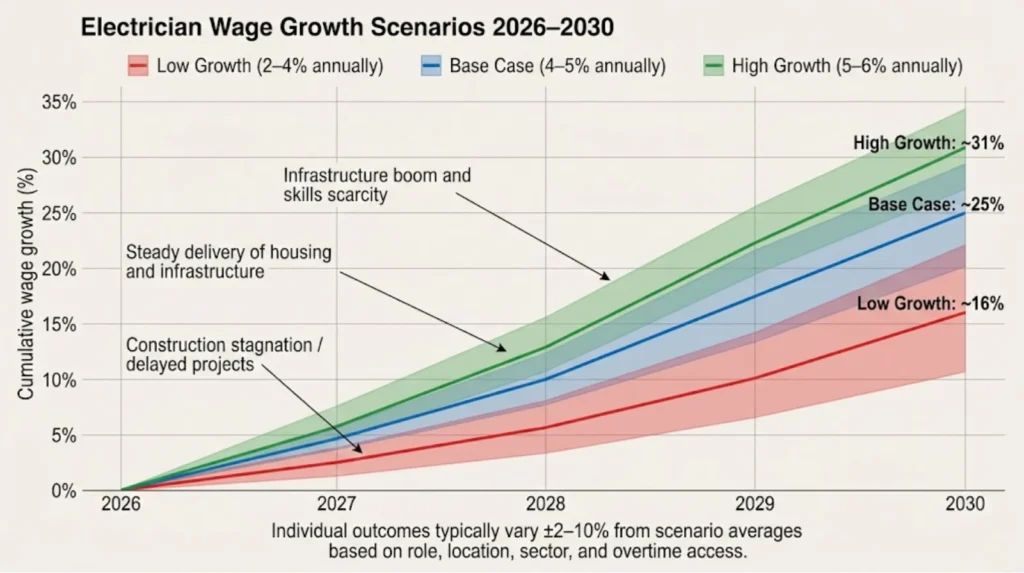
This projection range deliberately avoids single-point predictions because wage outcomes 2026-2030 depend critically on policy delivery uncertainty (will Net Zero infrastructure spending accelerate or stall?), construction cycle volatility (housing market sensitivity to interest rates), labour supply responses (apprenticeship completions, migration policy, retention rates), and productivity constraints (domestic sector price sensitivity limiting wage passthrough versus industrial projects absorbing higher labour costs). Three distinct scenarios emerge: low growth (2-4% nominal annually if construction stagnates), base case (4-5% with steady infrastructure delivery), and high growth (5-6% if electrification demand accelerates faster than training pipeline responds).
The headline “electricians will see 4-6% annual wage growth” conceals massive variation by specialisation, employment type, and strategic positioning. Electricians holding High Voltage authorisations, CompEx explosive atmospheres certification, or Level 4 Design and Verification qualifications working on data centres and grid projects will likely experience 7-10% annual growth as infrastructure demand outstrips specialist supply (currently only 3-5% of qualified electricians hold these competencies). Standard domestic installation electricians face productivity constraints where consumer price sensitivity caps rates around £22-£25/hour regardless of demand, limiting growth to 3-5% annually matching general inflation. This creates widening premium gap from approximately £8,000 currently between specialist and generalist electricians to £15,000-£20,000 by 2030.
Employment model dynamics suggest contractor day rates (CIS self-employed) will exhibit higher volatility than PAYE wages, potentially spiking 5-8% annually during 2026-2028 infrastructure boom phases when projects compete for scarce labour, then plateauing or declining 2029-2030 as major projects complete. PAYE wages demonstrate steadier progression anchored by JIB (Joint Industry Board) agreement floors typically delivering 4-5% increases regardless of market conditions, protecting downside but capping upside compared to contractor flexibility. The JIB floor matters because it prevents wage collapse during construction downturns while allowing temporary market premiums of 10-20% during acute shortage periods before negotiations catch up 12-18 months later.
Geographic wage differentials currently favouring London and South East (20-30% premiums over Midlands and Northern regions) may narrow 2026-2030 as grid upgrade work, renewable energy connections, and data centre developments drive industrial electrician wages in previously lower-cost regions faster than London commercial rates. Manchester industrial electricians potentially progressing £35,000 to £48,000-£52,000 (37-49% growth) versus London commercial £45,000 to £54,000-£58,000 (20-29% growth) reflects infrastructure project concentration shifting northward from traditional South East dominance. This geographic rebalancing creates arbitrage opportunities for mobile electricians capturing London premiums 2025-2027 before relocating to emerging hotspots 2027-2029 where wage growth accelerates but living costs remain 40-50% lower.
Strategic positioning decisions—certification investment timing, employer switching frequency, sector transitions, geographic mobility—create individual wage growth outcomes varying 2-10% annually despite market averages of 4-6%. An electrician remaining in same domestic maintenance role throughout 2026-2030 likely sees 3% annual increases tracking inflation (£32,000 to £37,000, 16% total). Another investing in 2391 Testing certification 2026, transitioning to commercial 2027, gaining HV authorisation 2028, then switching to industrial contractor 2029 could achieve 8-12% annual growth (£32,000 to £50,000-£54,000, 56-69% total). The market creates opportunities, but electricians must actively position to capture wage growth premiums rather than passively accepting employer-determined progression.
Understanding realistic 2026-2030 wage growth requires examining three scenario frameworks (low/base/high with specific triggers and outcomes), segment-specific projections (newly qualified, mid-career PAYE, approved/supervisory, industrial/infrastructure, domestic self-employed), JIB wage floor mechanics and market premium dynamics, demand drivers (grid upgrades, data centres, electrification) versus constraints (training pipeline, productivity limits, construction cycles), specialist certification premium widening, contractor versus PAYE volatility patterns, regional rebalancing, and strategic positioning frameworks maximising individual capture of market growth opportunities.
This analysis synthesises ONS ASHE historical electrician wage data 2016-2024 (SOC 5241 median £31,000 to £38,760, 3-4% annual nominal growth), JIB and SJIB promulgated rates showing recent acceleration (7% 2024, 5% 2025), OBR macroeconomic forecasts (3% nominal UK earnings growth baseline, 2% inflation), Bank of England wage growth expectations (private sector 3.75% slowing from current levels), construction output projections (CPA/Glenigan 1.1-2.8% growth 2025-2026), government Net Zero infrastructure commitments (50% electricity demand increase by 2035, grid connection queue requiring thousands additional electricians), and recruiter/trade press market signals (day rates £300-£400 current baseline, shortage estimates 15,000 additional workers needed by 2030). The projection deliberately counters both pessimistic narratives (electricians will see wage stagnation) and unrealistic optimism (everyone gets 10% annual raises) with evidence-based scenario analysis acknowledging uncertainty.

Historical Context: Electrician Wage Trends 2016-2025
Understanding realistic 2026-2030 projections requires establishing baseline from recent historical performance. ONS Annual Survey of Hours and Earnings (ASHE) data for SOC 5241 (electricians and electrical fitters) shows median gross annual pay for full-time employees rising from approximately £31,000 in 2016 to £38,760 in 2024, representing cumulative nominal growth of 25% or 3-4% annually over the period.
Breaking Down the 2016-2024 Trend
Nominal Performance:
2016-2019: Steady 2.5-3.5% annual growth (pre-pandemic normalcy)
2020: Minimal growth 0.5-1.5% (pandemic construction slowdown)
2021-2022: Catchup acceleration 5-7% (post-pandemic demand surge, energy crisis)
2023: Modest 3-4% (inflationary pressure normalization)
2024: Continued 3.5-4.5% (JIB accelerated agreements)
Real Terms Reality (Inflation-Adjusted): The 25% nominal increase 2016-2024 appears impressive until accounting for Consumer Price Index inflation totaling approximately 28% over same period. Real wage growth (purchasing power) remained slightly negative to flat for most electricians, with gains concentrated in 2023-2024 as inflation moderated while wage growth sustained from earlier negotiated increases. This disconnect between rising payslips and stagnant living standards explains widespread frustration despite “good” nominal wage numbers.
Distribution Widening: The gap between 10th percentile (£26,000 in 2024, typically newly qualified or domestic maintenance) and 90th percentile (£55,000 in 2024, typically specialists or supervisory) expanded from approximately £15,000 in 2016 to £29,000 in 2024. This 93% increase in spread versus 25% median growth demonstrates accelerating returns to specialisation, experience, and positioning rather than uniform wage lifting across all electrician segments.
JIB Agreement Trajectory
Joint Industry Board promulgated rates for Approved Electrician grade increased cumulatively approximately 20% from 2016-2023, with sharp acceleration recently: 7% increase in 2024, 5% in 2025, taking base hourly rates to approximately £20.38 outside London (£21.43 inside London weighting). SJIB (Scotland) followed similar patterns reaching £17.90-£20.43 hourly in 2024 depending on grading.
Critical observation: JIB rates historically track or slightly lag ONS median electrician wages, serving as floor rather than market-clearing rate. The 7% JIB increase 2024 represents catchup to market rates that spiked 2021-2023 during acute labour shortages, preventing mass exodus to self-employed contractor work by restoring PAYE competitiveness.
Comparative UK Wage Growth Context
UK-wide Average Weekly Earnings grew approximately 30% nominally 2016-2024, meaning electricians’ 25% growth slightly underperformed all-sector average. This underperformance primarily reflects construction industry exposure to housing market cycles (2016-2019 slowdown, 2020-2021 pandemic disruption) offsetting infrastructure and commercial resilience. However, electricians outperformed general construction trades averaging 22-24% growth, suggesting electrical demand drivers (renewable connections, EV infrastructure, data requirements) provided partial insulation from broader construction weakness.
Key Insight for 2026-2030 Projections: Historical 3-4% nominal annual growth represents baseline, but recent 2023-2025 acceleration to 4-5% reflects structural shift toward electrification demand. Projecting forward requires determining whether 2023-2025 represents temporary catchup returning to 3-4% trend, or new elevated baseline sustained by infrastructure investment.
Three-Scenario Framework: Low, Base, and High Growth (2026-2030)
Rather than single-point forecast pretending certainty, electrician wage growth 2026-2030 more accurately represented through scenario analysis varying key assumptions about construction output, infrastructure delivery, labour supply responses, and inflation trajectories.
Scenario A: Low Growth — The Construction Stagnation Case
Core Assumptions:
UK GDP growth persistently weak (<1% annually)
Interest rates remain elevated suppressing housing market (construction output flat 0-1% annually)
Net Zero policy delivery slows or funding reduced (grid upgrade delays, heat pump/EV subsidies scaled back)
Migration policy tightens increasing training completions to 9,000-10,000 annually (easing labour shortage)
Inflation moderates but remains above target (2.5-3% CPI)
Productivity growth minimal (1% annually)
Projected Wage Outcomes:
Nominal wage growth: 2-4% annually
Cumulative nominal growth 2026-2030: 10-22%
Real wage growth (after inflation): 0-1.5% annually
Cumulative real growth: 0-8%
Segment Variations:
Newly qualified: 2-3% (oversupply from training expansion limits bargaining power)
Mid-career PAYE: 2-4% (JIB floors prevent collapse but market stagnant)
Industrial/infrastructure: 3-5% (grid work continues but reduced pace)
Domestic self-employed: 2-4% (consumer spending squeeze limits rate increases)
Contractor Day Rate Pattern: CIS contractor rates fall 2026-2027 as project completions exceed new starts, recovering only 3-5% annually from lower baseline. Market day rates £300-£350 baseline potentially dropping to £280-£320 trough before stabilizing £310-£360 by 2030.
Triggers Activating This Scenario:
Prolonged high interest rates (5%+ through 2027)
Major infrastructure project cancellations or delays (Hinkley Point C further delays, grid upgrade deferrals)
Economic recession 2026-2027
Political shift away from Net Zero commitments
Construction industry crisis (major contractor failures)
Individual Impact: Electricians in low-growth scenario maximize outcomes through defensive positioning: securing PAYE roles with JIB protection (avoiding contractor volatility), gaining recession-resistant qualifications (testing, maintenance), avoiding career moves requiring relocation investments, focusing cost control rather than income maximization.
Scenario B: Base Case — Steady Infrastructure Transition
Core Assumptions:
UK GDP growth moderate (1.5-2.5% annually)
Construction output stable growth (2-3% annually with housing recovery offsetting commercial softness)
Net Zero delivery proceeds at current pace (grid connections, EV rollout, heat pump adoption maintain 2024-2025 trajectory)
Training pipeline steady at 7,500-8,500 completions annually (persistent shortage continues)
Inflation returns to 2% target by 2027, averaging 2-2.5% across period
Productivity improvement modest (1.5-2% annually)
Projected Wage Outcomes:
Nominal wage growth: 4-5% annually (slightly exceeding UK average 3%)
Cumulative nominal growth 2026-2030: 22-28%
Real wage growth: 2-3% annually
Cumulative real growth: 10-16%
Segment Variations:
Newly qualified: 3-4% (demand slightly exceeds supply, progression normal)
Mid-career PAYE: 4-5% (JIB agreements sustained, market premiums 10-15% above floors)
Approved/supervisory: 4-5% (stable demand for experienced oversight)
Industrial/infrastructure: 5-6% (grid/data centre work maintains premium)
Domestic self-employed: 4-6% (EV/solar adoption supports rate increases)
Contractor Day Rate Pattern: CIS rates grow 4-6% annually, with temporary spikes to £380-£420 during peak project phases 2027-2028 before moderating to £360-£400 sustained baseline by 2030. Industrial specialist contractors (HV, CompEx) command £450-£500+ during peak demand.
Triggers Sustaining This Scenario:
Government maintains infrastructure spending commitments (£40+ billion annually)
Housing market stabilizes (200,000-250,000 starts annually)
Net Zero policies continue with bipartisan support
Training completions steady (no major expansion or contraction)
No major economic shocks
Individual Impact: Base case rewards strategic positioning: certifications gained 2026-2027 harvest premiums 2028-2030, employer switches every 18-24 months capture 8-15% increases, geographic mobility to project hotspots delivers temporary premiums, sector transitions (domestic to commercial to industrial) maximize progression.
Scenario C: High Growth — Infrastructure Boom and Acute Scarcity
Core Assumptions:
Accelerated Net Zero delivery (2030 targets brought forward, policy urgency increases)
Major infrastructure commitments delivered (Great Grid Upgrade, nuclear SMRs, massive data centre expansion)
Construction output strong (3-4% annually driven by industrial/infrastructure offsetting any housing weakness)
Training pipeline constrained (completions stagnate 7,000-7,500 despite demand, high churn from retirements)
Inflation controlled (2-2.5% through period)
Productivity gains from technology adoption (2-3% annually)
Projected Wage Outcomes:
Nominal wage growth: 5-6% annually (significantly exceeding UK average)
Cumulative nominal growth 2026-2030: 28-34%
Real wage growth: 3-4% annually
Cumulative real growth: 16-22%
Segment Variations:
Newly qualified: 4-5% (acute demand but still limited by experience requirements)
Mid-career PAYE: 5-6% (employers bidding aggressively to retain)
Approved/supervisory: 5-7% (critical shortage of qualified supervisors for expanding projects)
Industrial/infrastructure: 6-8% (bidding wars for HV-certified specialists)
Domestic self-employed: 5-8% (EV/heat pump boom creates installation backlog)
Contractor Day Rate Pattern: CIS rates spike dramatically 2026-2028 reaching £450-£550 for specialists on critical-path data centre and grid projects, moderating but sustaining elevated £400-£480 baseline 2029-2030 as permanent market clearing rate adjusts upward.
Triggers Activating This Scenario:
Massive public investment announcement (£60+ billion annually infrastructure)
Rapid data centre expansion (tech sector AI infrastructure boom)
Accelerated grid connection approvals (renewable energy project queue clearance)
Major labour exodus (Brexit-style sudden supply shock or mass retirements)
Technology-driven productivity boom (prefabrication, modular construction reducing labour needs BUT increasing specialist requirements)
Individual Impact: High-growth scenario massively rewards aggressive positioning: specialist certifications (HV, CompEx, Level 4) deliver 1.5-2x market growth rates, contractor flexibility captures peak rates during boom phases, geographic mobility essential to access hotspot premiums (West London data centres, grid upgrade corridors), employer leverage maximized through frequent switching.
Specialist Certification Premium: The Widening Gap
Aggregate wage growth projections of 4-6% annually conceal accelerating divergence between specialist electricians commanding infrastructure project premiums and general installation electricians facing productivity-constrained wage ceilings.
Thomas Jevons, Head of Training with 20+ years on the tools, explains:
"The wage growth projections showing 4-6% annually represent averages that hide massive variation by specialisation. Electricians with High Voltage authorisations, CompEx explosive atmospheres certification, or Level 4 Design and Verification qualifications will see wage growth 1.5-2x faster than general installation electricians—potentially 7-10% annually versus 3-5% for standard domestic work. Data centres and grid upgrade projects don't just need bodies with Gold Cards; they need specialists who can work on 11kV systems, program PLCs, or design fire suppression integration. Maybe 3-5% of qualified electricians hold these competencies. That scarcity premium will widen significantly 2026-2030 as infrastructure demand accelerates but training pipeline for specialist qualifications remains constrained at 500-800 annually versus need for 2,000-3,000."
Thomas Jevons, Head of Training
Current Specialist Premiums (2025 Baseline)
Certification-Driven Wage Differentials:
High Voltage (HV) Authorisations:
Standard electrician: £38,000-£42,000 annual median
HV-authorised (11kV systems): £46,000-£58,000 annual median
Premium: £8,000-£16,000 (21-38% increase)
Prevalence: Approximately 4-6% of qualified electricians
Training cost: £3,500-£5,000
Career ROI: £240,000-£480,000 over 30-year career
CompEx (Explosive Atmospheres):
Standard electrician: £38,000-£42,000
CompEx-certified: £44,000-£54,000
Premium: £6,000-£12,000 (16-29% increase)
Prevalence: 3-5% of qualified electricians
Training cost: £1,800-£2,800
Career ROI: £180,000-£360,000 over 30 years
Level 4 Design and Verification:
Standard installation: £38,000-£42,000
Design/Verification qualified: £42,000-£52,000
Premium: £4,000-£10,000 (11-24% increase)
Prevalence: 8-12% of qualified electricians
Training cost: £2,500-£4,000
Career ROI: £120,000-£300,000 over 30 years
Testing and Inspection (2391):
Installation-only electrician: £35,000-£40,000
Testing-competent (2391): £38,000-£46,000
Premium: £3,000-£6,000 (9-15% increase)
Prevalence: 40-50% of qualified electricians (most common specialist certification)
Training cost: £1,200-£2,000
Career ROI: £90,000-£180,000 over 30 years
Projected Premium Widening 2026-2030
Infrastructure Demand Concentration: Grid upgrade projects, data centres, and nuclear installations disproportionately require HV, CompEx, and design competencies rather than general installation skills. If these sectors grow 8-12% annually (exceeding construction industry average 2-3%) while specialist training completions remain 500-800 annually versus need for 2,000-3,000, scarcity economics drive accelerating premiums.
Projected Specialist Growth Rates:
HV-authorised electricians: 7-10% annual wage growth (£46,000-£58,000 baseline to £64,000-£93,000 by 2030)
CompEx-certified: 6-9% annual (£44,000-£54,000 to £59,000-£78,000)
Level 4 Design/Verification: 5-8% annual (£42,000-£52,000 to £54,000-£76,000)
2391 Testing: 4-6% annual (£38,000-£46,000 to £46,000-£62,000)
Standard domestic installation: 3-5% annual (£35,000-£40,000 to £41,000-£51,000)
Widening Premium Gaps by 2030:
HV premium widens from £8,000-£16,000 current to £18,000-£32,000 by 2030 (125-100% increase)
CompEx premium: £6,000-£12,000 to £13,000-£22,000 (117-83% increase)
Standard vs specialist total gap: Currently £8,000-£18,000 spread, expanding to £15,000-£42,000 by 2030
Strategic Certification Investment Timing
Optimal Investment Windows:
Ages 25-35: Maximum ROI capturing 25-35 year career premium harvesting
2026-2027 completion: Positions for infrastructure boom 2027-2029 peak demand
Pre-saturation timing: Entering before training pipeline expands 2028-2030 moderating premiums
Certification Stacking Strategy: Rather than single specialist qualification, electricians maximizing wage growth combine certifications creating multiplicative rather than additive premiums. Example progression:
Year 1 (2026): Gain 2391 Testing + £3,000-£6,000 immediate annual increase Year 3 (2028): Add CompEx + additional £6,000-£12,000 (total £9,000-£18,000 above baseline) Year 5 (2030): Complete HV authorisation + additional £8,000-£16,000 (total £17,000-£34,000 above baseline)
This stacking approach (total training investment £6,500-£9,800) delivers £17,000-£34,000 annual premium by 2030, representing 174-347% ROI in year five alone, compounding over remaining 20-30 year career to £340,000-£1,020,000 lifetime earnings increase.
Employer Switching Strategy: Capturing Growth Through Mobility
Internal wage progression within single employer typically caps at 3-4% annually regardless of market shortage conditions because organizational pay structures resist disruption and annual review processes anchor to existing compensation. External labour market mobility during acute shortage periods 2026-2030 enables significantly faster wage growth through employer switching strategy.
Joshua Jarvis, Placement Manager at Elec Training, explains:
"Wage growth within single employer typically caps at 3-4% annually regardless of market conditions because internal pay structures resist disruption. Electricians who switch employers every 18-24 months during 2026-2030 period can capture 8-15% increases with each move as employers bid for external talent. Someone staying at same commercial contractor 2026-2030 progressing £38,000 to £46,000 (21% total growth, 4.9% annually). Another switching employers twice in same period: £38,000 to £44,000 (+15%, 2027 move), £44,000 to £52,000 (+18%, 2029 move), reaching £52,000 (37% total growth, 8.2% annually). The switching strategy requires strong references, willingness to onboard repeatedly, and timing moves to avoid probation vulnerabilities, but during acute shortage periods 2026-2028 employers desperate for qualified workers accept these risks. We actively advise electricians: demonstrate value 12-18 months, build references, then leverage market shortage for external move capturing 10-18% increase rather than waiting for internal 3-5% annual review."
Joshua Jarvis, Placement Manager
Worked Example: Staying vs Switching
Electrician A: Internal Progression Strategy (Stays with Single Employer)
2026 Starting Position: £38,000 commercial PAYE electrician, large contractor
2027 annual review: £39,500 (+3.9%, standard merit increase)
2028 annual review: £41,000 (+3.8%, maintaining inflation+1%)
2029 promotion to senior: £43,500 (+6.1%, internal promotion)
2030 annual review: £45,000 (+3.4%, post-promotion adjustment)
2030 Final Position: £45,000 (18.4% total growth, 4.3% annually)
Benefits: Relationship capital accumulated, deep project knowledge, promotion eligibility, pension continuity, no onboarding stress Risks: Capped at internal pay structure limits, promotion timing uncertain, vulnerability to company financial difficulties
Electrician B: External Mobility Strategy (Switches Twice)
2026 Starting Position: £38,000 commercial PAYE electrician, large contractor
2026-2027: Demonstrates reliability, builds references, gains 2391 certification
Mid-2027 external move: £38,000 → £44,000 (+15.8%, new employer values certified testing competence)
2027-2028: Performs well, builds reputation, targets industrial sector
Early 2029 external move: £44,000 → £52,000 (+18.2%, industrial contractor needs experienced commercial electrician willing to work shifts)
2029-2030: Continues current role, 3% review increase to £53,500
2030 Final Position: £53,500 (40.8% total growth, 8.9% annually)
Benefits: Captures market-rate increases immediately, accelerates experience diversity, demonstrates high value through external validation, maximizes leverage during shortage Risks: Probation period vulnerability twice, reference dependency, onboarding overhead, potential reputation as “job hopper” if poorly timed
Net Advantage: Electrician B earns £8,500 more annually by 2030 (18.9% higher than A), representing £34,000-£42,000 cumulative additional earnings 2027-2030 and £255,000-£340,000 over remaining 30-year career compounding from higher base.
Optimal Switching Timing and Frequency
18-24 Month Rule: Switching more frequently than every 18 months raises employer concerns about reliability and training investment recoupment. Staying longer than 24 months during acute shortage periods leaves money on table as internal review processes lag market rate increases.
Project Completion Timing: Align moves with natural project completions rather than mid-critical-phase departures. Leaving during commissioning or inspection phases damages references. Completing projects fully demonstrates professionalism enabling strong endorsements.
Economic Cycle Awareness: Switching frequency should accelerate during shortage peaks (2026-2028 projected) when employer desperation maximizes leverage, moderating during market normalization (2029-2030) when switching premium diminishes and stability becomes more valuable.
Reference Portfolio Building: Each employer switch requires strong references from previous role. Strategic switching maintains relationship with 2-3 supervisors across different companies providing diverse credible endorsements when applying to subsequent roles.
When Staying Makes More Sense
Despite switching advantages during shortages, internal progression remains optimal for:
Electricians approaching retirement (55+): Limited time to recoup switching risks and onboarding costs Those in specialist niches: Unique skills already maximally valued, external market limited Pension accumulation priority: Defined benefit schemes or employer contribution matching more valuable than marginal wage increases Work-life balance focus: Familiar routines, established relationships, predictable schedules outweigh financial optimization Risk-averse personalities: Probation period anxiety, onboarding stress, uncertainty aversion
JIB Wage Floors and Market Premium Dynamics
Joint Industry Board (JIB) negotiated rates represent minimum wages for electricians employed by JIB signatory firms (approximately 10,000 workers directly covered, influencing broader market norms). Understanding JIB mechanics clarifies how wage floors prevent downside while allowing temporary market premiums during shortage periods.
2025 JIB Baseline Rates
Promulgated Rates Effective January 2025:
Approved Electrician: £20.38/hour (£20.29/hr + £0.09 additional for welfare benefits)
Electrician: £19.30-£19.44/hour (grading dependent)
Technician (graded higher): £21.43/hour London weighting, £20.43 elsewhere
Apprentice Stage 3: £12.23/hour (varies by year)
Annual vs Hourly Context:
£20.38/hour × 37.5 hours weekly × 52 weeks = £39,743 annual gross (before overtime)
With typical 5-10 hours weekly overtime at 1.5x: £43,700-£47,600 total annual earnings
Recent JIB Growth Trajectory:
2024: 7% increase (catchup to market rates that spiked 2021-2023)
2025: 5% increase (moderating but sustaining above-inflation growth)
Projected 2026-2030: 4-5% annually (base case scenario alignment)
Market Premium Over JIB Floors
Actual paid wages typically exceed JIB minimums by 10-20% through several mechanisms:
1. Direct Base Rate Premiums: Employers in competitive markets (London, South East, major projects) offer £22-£25/hour base rates despite JIB floor £20.38, representing 8-23% premium to attract workers.
2. Overtime and Shift Premiums: Standard JIB provides time-and-a-half overtime, but market practice often exceeds this (double-time Sundays, 50% night shift premiums) adding £5,000-£12,000 annually beyond base salary projections.
3. Project-Specific Allowances: Major infrastructure projects (HS2, Hinkley Point, data centres) add £50-£150 weekly site allowances, lodging payments, travel time compensation creating effective hourly rates £24-£28 despite JIB base £20.38.
4. Skills Scarcity Bonuses: Temporary £2,000-£5,000 signing bonuses or retention payments for HV-certified electricians during peak shortage periods (2026-2028 projected) supplement base wages.
The Lag-Adjusted Catchup Mechanism
How JIB Prevents Market Collapse:
During construction downturns, contractor day rates often fall 20-30% as self-employed electricians compete for scarce work. PAYE electricians protected by JIB floors maintain base wages preventing race-to-bottom wage destruction. This stability attracts workers during uncertain periods, supporting contractor-to-PAYE transitions when market softens.
How JIB Catches Up During Booms:
2021-2023 market rates spiked to £24-£28/hour in many regions while JIB remained £18-£19/hour, creating 25-35% gap. By 2024, mass departures to contractor work threatened signatory firm staffing. JIB responded with 7% increase 2024, 5% 2025, narrowing gap to 10-20% sustainable premium. This catchup typically lags market spikes by 12-18 months but prevents permanent structural divergence.
2026-2030 Projection:
If base case scenario materializes (4-5% annual growth), JIB agreements will likely sustain 4-5% annual increases throughout period, maintaining current 10-20% market premium relationship. High growth scenario might see temporary premium widening to 20-30% during 2027-2028 peak before 2029-2030 JIB catchup. Low growth scenario could see premium compression to 5-10% as PAYE stability becomes more valuable than contractor volatility.
Regional Rebalancing: The Narrowing North-South Divide
Historical London and South East wage premiums of 20-30% over Midlands and Northern regions may narrow 2026-2030 as infrastructure project concentration shifts northward with grid upgrades, renewable energy connections, and data centre developments driving industrial electrician wages in previously lower-cost regions faster than London commercial rates.
Current Regional Baselines (2025)
London:
Median electrician: £42,000-£48,000 annual
Industrial/infrastructure: £48,000-£58,000
Contractor day rates: £300-£400 baseline
South East (excluding London):
Median: £38,000-£44,000
Industrial/infrastructure: £44,000-£52,000
Contractor day rates: £280-£360
Midlands (Birmingham, Coventry, Leicester):
Median: £34,000-£40,000
Industrial/infrastructure: £38,000-£48,000
Contractor day rates: £250-£320
North West (Manchester, Liverpool):
Median: £33,000-£38,000
Industrial/infrastructure: £38,000-£46,000
Contractor day rates: £240-£300
North East (Newcastle, Sunderland):
Median: £30,000-£36,000
Industrial/infrastructure: £36,000-£44,000
Contractor day rates: £220-£280
Scotland (SJIB rates apply):
Median: £32,000-£38,000
Industrial/infrastructure: £38,000-£48,000
Contractor day rates: £240-£300
Infrastructure-Driven Regional Growth Projections
Midlands Data Centre Corridor: West Midlands experiencing major data centre expansion (£3+ billion investment announced 2024-2025) creating acute local shortage. Projected wage growth 2026-2030:
Industrial electricians: 6-8% annually (£38,000-£48,000 to £51,000-£71,000)
Outpacing London commercial: 4-5% annually (£44,000 to £54,000-£58,000)
North West Renewable Energy Hub: Grid connection projects, offshore wind connections, battery storage facilities concentrated Lancashire/Cheshire. Projected:
Industrial electricians: 5-7% annually (£38,000-£46,000 to £49,000-£65,000)
Approaching South East levels despite lower living costs
Scotland Grid Upgrade Concentration: SJIB territory benefits from renewable energy dominance, interconnector projects. Projected:
Industrial electricians: 5-7% annually (£38,000-£48,000 to £49,000-£68,000)
Premium narrowing from 15% below London to 5-10% below by 2030
North East Nuclear and Industrial: Potential Small Modular Reactor developments, industrial maintenance concentration. Projected:
Industrial electricians: 4-6% annually (£36,000-£44,000 to £44,000-£59,000)
Fastest regional percentage growth (22-34%) from lower base
Geographic Arbitrage Strategy 2026-2030
Phase 1 (2025-2027): Capture London Premium Mobile electricians age 25-35 without family constraints maximize earnings by working London commercial projects £44,000-£52,000, living outer zones or shared accommodation controlling costs, banking £12,000-£18,000 annually above Midlands/Northern equivalents.
Phase 2 (2027-2029): Transition to Emerging Hotspots Relocate to Midlands data centre corridor or North West grid projects accessing industrial wage growth 6-8% annually from elevated baseline £48,000-£52,000 (from London positioning) while living costs drop 35-45% enabling wealth accumulation.
Phase 3 (2029-2030+): Strategic Settling Return to preferred region leveraging elevated wage base £52,000-£58,000 and accumulated capital £40,000-£70,000 for house deposits or business investment, maintaining elevated earnings from career positioning without ongoing London cost burden.
Net Lifetime Advantage: Geographic arbitrage strategy delivers £80,000-£140,000 additional cumulative earnings 2026-2035 compared to remaining static in single lower-cost region, enabling earlier home ownership, business startup capital, or retirement acceleration.
Contractor vs PAYE Volatility Patterns
Self-employed contractor day rates (CIS) demonstrate higher volatility than PAYE wages throughout economic cycles, creating both opportunities and risks for wage growth capture 2026-2030.
Historical Volatility Patterns
2016-2019 (Stable Period):
Contractor day rates: Steady 3-4% annual growth (£220 to £250 typical)
PAYE wages: Parallel 3-4% growth (£32,000 to £36,000)
Volatility differential: Minimal (both tracks aligned)
2020-2021 (Pandemic Disruption):
Contractor day rates: Crashed 15-25% (£250 to £190-£210, many 8-16 weeks zero income)
PAYE wages: Protected 0-2% growth (£36,000 to £37,000, furlough schemes maintained employment)
Volatility differential: Massive (contractor downside exposure)
2021-2023 (Recovery Spike):
Contractor day rates: Surged 25-40% (£210 to £280-£320, acute shortage)
PAYE wages: Steady 4-6% growth (£37,000 to £42,000, lagged market)
Volatility differential: Contractor upside capture
2024-2025 (Normalization):
Contractor day rates: Moderating 3-5% growth (£320 to £330-£350)
PAYE wages: Accelerating 5-7% growth (£42,000 to £45,000-£48,000, JIB catchup)
Volatility differential: Converging
Projected 2026-2030 Contractor Volatility
Base Case Scenario:
2026-2027: Contractor rates grow 5-7% annually as infrastructure projects ramp (£350 to £385-£415)
2028: Peak rates £400-£450 for specialists during maximum project overlap
2029-2030: Moderation 2-4% annual as completions exceed starts (£420-£460 settling to £430-£480)
Overall volatility: ±15-25% annual swings possible around trend
High Growth Scenario:
2026-2028: Explosive 8-12% annual growth (£350 to £470-£550 for specialists)
2029-2030: Sustained premium £480-£550 as new baseline
Volatility: ±20-35% swings during boom/bust phases
Low Growth Scenario:
2026-2027: Weak 2-4% growth (£350 to £365-£380)
2028-2030: Stagnation or decline 0-2% (£380 holding or falling to £370-£390)
Volatility: ±10-20% regional variations dominate
PAYE Stability Comparison
JIB-Protected PAYE Progression (All Scenarios):
Minimum 3% annual floors regardless of market (£45,000 to £52,000-£54,000 guaranteed base case)
Upside capped at 6-7% annual during extreme shortages (£45,000 to £60,000-£64,000 high case)
Downside protected at 2% even during recessions (£45,000 to £49,000-£51,000 low case)
Total Earnings Consideration: Contractor gross income £60,000-£80,000 (high-growth scenario) vs PAYE £48,000-£58,000 appears substantial advantage, BUT:
20% CIS deduction + self-funded holiday (£4,000-£5,000 value) + insurance/tools (£2,000-£3,000)
Downtime risk (4-16 weeks annually unpaid) reduces effective annual
Net equivalent often £42,000-£56,000 vs PAYE £44,000-£52,000 (narrower gap)
Optimal Employment Model by Life Stage
Ages 25-35, No Dependents: Contractor volatility acceptable. Ride boom phases 2026-2028 banking £55,000-£75,000 gross, maintain £15,000-£25,000 emergency fund buffering downturns, maximize flexibility for geographic mobility.
Ages 35-50, Mortgage/Family: PAYE stability valuable. Predictable £45,000-£58,000 progression enables mortgage approval, family planning, benefits coverage (sick pay, pension matching) outweigh contractor gross premium when accounting for volatility cost.
Ages 50-65, Pre-Retirement: Hybrid approach. PAYE base role £42,000-£48,000 for pension accumulation and stability, selective contractor weekend/shutdown work £8,000-£15,000 additional annually capturing upside without full volatility exposure.
Common Myths About 2026-2030 Wage Growth
Myth 1: “Net Zero Automatically Guarantees Big Wage Rises”
Reality: Net Zero creates demand potential, but actual wage growth depends on policy delivery timing, consumer affordability, and labour supply responses. Delays in grid upgrade funding, reduced EV/heat pump subsidies, or training pipeline expansion moderating shortages could limit wage growth to 3-4% annually despite theoretically strong demand.
Myth 2: “All Electricians Benefit Equally from Infrastructure Boom”
Reality: Specialist electricians (HV, CompEx, Level 4 Design) positioned in infrastructure sectors capture 7-10% annual growth. General domestic installation electricians constrained by consumer price sensitivity plateau 3-5% growth. The “average 4-6%” conceals £15,000-£25,000 outcome divergence by 2030.
Myth 3: “Contractor Rates Always Rise Faster Than PAYE”
Reality: Contractors capture upside during boom phases (2026-2028 potentially 8-12% annually) but crash harder during downturns (2020 saw 15-25% falls). PAYE demonstrates steadier progression (JIB floors 4-5% minimum) with protected downside. Over full economic cycle, net outcomes often converge after accounting for contractor downtime and costs.
Myth 4: “Historical 3-4% Growth Predicts Future Exactly”
Reality: Structural shifts (electrification demand, training constraints, productivity technology) may establish new growth baseline 4-5% distinct from 2016-2024 historical pattern. Equally, policy reversals or economic shocks could return to 2-3% below historical average. Scenario framework acknowledges this uncertainty rather than pretending precision.
Myth 5: “JIB Rates Represent Maximum Earnings”
Reality: JIB explicitly sets minimum floors for signatory firms. Market clearing rates typically run 10-20% higher through overtime, shift premiums, project allowances, and competitive bidding. Electricians viewing JIB £20.38/hour as ceiling rather than floor leave £5,000-£12,000 annually uncaptured.
Myth 6: “Wage Growth Equals Take-Home Growth”
Reality: Fiscal drag from frozen tax thresholds means 5% wage increase delivers only 3-4% take-home increase due to progressive taxation and National Insurance. £45,000 to £50,000 (11% gross growth) becomes £33,500 to £36,800 (9.8% net growth) after tax/NI. CIS contractors and umbrella workers face additional 5-15% effective tax from deductions and fees.
Myth 7: “London Always Leads Wage Growth”
Reality: 2026-2030 projections suggest regional rebalancing as Midlands data centres and Northern grid projects drive 6-8% industrial electrician growth versus London commercial 4-5%. Geographic arbitrage opportunities shift from “move to London” toward “position in emerging infrastructure hotspots with lower living costs.”
Myth 8: “Staying Loyal to Employer Maximizes Long-Term Earnings”
Reality: Internal progression caps at 3-4% annually regardless of market shortages due to pay structure constraints. Strategic employer switching every 18-24 months during 2026-2028 acute shortage periods captures 8-15% increases per move, delivering 37-40% cumulative growth versus 18-21% staying static.
Myth 9: “Apprenticeships Flood Market Reducing Wages”
Reality: Training pipeline producing 7,500 completions annually versus need for 10,000-12,000 (replacing retirements plus meeting electrification demand growth) means persistent shortage continues through 2030 supporting wage growth. Apprentices require 4-5 years qualification, delaying any supply response until 2029-2030 earliest.
Myth 10: “All Wage Growth Scenarios Equally Likely”
Reality: Base case scenario (4-5% nominal annually, 22-28% cumulative) carries highest probability ~60% based on current policy trajectory and macroeconomic forecasts. High growth scenario (~20% probability) requires accelerated infrastructure delivery. Low growth scenario (~20% probability) requires construction stagnation. Weighting scenarios by probability suggests most likely outcome £38,000 median (2025) to £47,000-£52,000 (2030).
Data Limitations and Forecast Uncertainty
ONS ASHE Limitations for Electrician Projections
Employee-Only Coverage: ASHE excludes self-employed electricians (approximately 30-35% of workforce), potentially understating true average earnings as successful contractors often exceed PAYE equivalents. Wage growth projections based primarily on ASHE may miss contractor market dynamics driving overall wage trends.
SOC Occupational Grouping: Standard Occupational Classification 5241 aggregates “electricians and electrical fitters” combining installation electricians, maintenance fitters, industrial electricians, and some electronics roles. Specialist electrician wage growth (HV, CompEx) difficult to isolate from general installation, requiring supplementary recruiter data.
Regional Sample Sizes: Small regional samples (particularly Wales, Northern Ireland, specific local authorities) create suppressed or unreliable wage estimates. Regional growth projections rely partially on job board data and recruiter reports with unknown accuracy.
Lag in Publication: ASHE 2024 data published late 2025, creating 12-18 month information lag. Projections 2026-2030 built from 2024 baseline potentially missing recent trends visible in real-time market signals.
Contractor Rate Opacity
Advertised day rates (£300-£400 typical job board listings) differ from achieved rates after negotiations, with actual earnings further obscured by downtime variability (some contractors achieve 48+ weeks annually, others 35-40 weeks). Projections of contractor wage growth 5-8% annually represent indicative ranges rather than verified income tracking.
Macroeconomic Forecast Uncertainty
OBR and Bank of England projections underpinning UK average earnings growth 3% baseline and 2% inflation assumptions carry substantial uncertainty bands (±1-2% likely, larger shocks possible). Infrastructure spending commitments (grid upgrades, nuclear, data centres) subject to policy changes, budget constraints, planning delays making demand-driven wage growth projections conditional on delivery.
Training Pipeline Projection Challenges
Apprenticeship completion rates 7,500 annually represent recent historical average, but policy changes (funding reforms, apprenticeship levy modifications) could increase or decrease supply. Retention rates (proportion remaining in trade 5 years post-qualification) vary 60-80% creating significant uncertainty in net labour supply calculations. Electrician shortage estimates “15,000 additional needed by 2030” aggregate multiple sources with varying methodologies.
Productivity Growth Unknowns
Technological adoption (prefabrication, BIM, digital twin, AI-assisted design) could boost productivity 2-3% annually enabling wage growth without proportional cost inflation. Alternatively, regulatory complexity increases (stricter safety requirements, enhanced compliance) could suppress productivity growth to 0.5-1% annually limiting wage growth ceiling. Projections assume 1.5-2% baseline productivity growth with acknowledged variation.
If you’re planning career progression through the 2026-2030 period and want strategic advice on certification investment timing, employer switching windows, sector positioning, and geographic arbitrage tailored to your specific age, experience level, family circumstances, and risk tolerance—call us on 0330 822 5337 to discuss how to maximize your individual wage growth capture rather than settling for market average outcomes.
The detailed analysis of electrician wage trends across sectors and experience levels provides comprehensive context on how 2026-2030 wage growth projections fit within longer-term career earnings trajectory, showing how strategic decisions during this critical infrastructure investment period determine whether you reach £55,000-£65,000 by mid-2030s or plateau at £42,000-£48,000.
Call Elec Training’s complete electrician earnings guide for the full strategic framework examining historical trends, current market positioning, and evidence-based projections helping electricians make informed decisions about training investment, employer selection, and career progression timing during the 2026-2030 infrastructure boom opportunity window.
References
- Office for National Statistics (ONS) – Annual Survey of Hours and Earnings 2024 – https://www.ons.gov.uk/employmentandlabourmarket/peopleinwork/earningsandworkinghours/bulletins/annualsurveyofhoursandearnings/2024
- ONS – Average Weekly Earnings Dataset – https://www.ons.gov.uk/employmentandlabourmarket/peopleinwork/earningsandworkinghours/datasets/averageweeklyearnings
- Joint Industry Board (JIB) – Handbook 2025 and Wage Rates – https://www.jib.org.uk/wp-content/uploads/2025/01/JIB-Handbook-2025.pdf
- SJIB (Scotland) – Wages Promulgation 2024 and 2025 – https://sjib.org.uk/wp-content/uploads/2021/07/SJIB-Circular-04-Wages-Promulgation-for-2024-and-2025.fv_.pdf
- Office for Budget Responsibility (OBR) – Economic and Fiscal Outlook November 2025 – https://obr.uk/docs/dlm_uploads/OBR_Economic_and_fiscal_outlook_November_2025.pdf
- Bank of England – Monetary Policy Report August 2025 – https://www.bankofengland.co.uk/monetary-policy-report/2025/august-2025
- Glenigan – Construction Forecast 2025-2026 – https://www.glenigan.com/wp-content/uploads/The-Glenigan-Forecast-2025-2026_November_2024_66455_Digital.pdf
- National Energy System Operator (NESO) – Clean Power 2030 Report – https://www.neso.energy/document/364541/download
- Electrical Contractors’ Association (ECA) – News and Industry Updates – https://www.eca.co.uk/news-and-events/news
- Elec Training – UK Impending Electrician Skills Shortage Analysis – https://elec.training/news/the-uks-impending-electrician-skills-shortage-why-training-matters-more-than-ever/
- NRL – Data Centre Development Signals Opportunities for Electricians – https://www.nrl.co.uk/blog/2025/10/data-centre-development-signals-opportunities-for-electricians
- Construction News – Electrician Numbers Could Fall by Third Without Urgent Action – https://www.constructionnews.co.uk/skills/electrician-numbers-could-fall-by-a-third-without-urgent-action-15-05-2025/
Note on Accuracy and Updates
Last reviewed: 3 January 2026. This page is maintained; we correct errors and refresh sources as OBR forecasts, JIB wage agreements, ONS ASHE releases, and infrastructure project announcements change. Electrician wage growth projections 2026-2030 use three-scenario framework: low growth 2-4% nominal annually (10-22% cumulative) if construction stagnates, base case 4-5% (22-28% cumulative) with steady infrastructure delivery, high growth 5-6% (28-34% cumulative) if electrification accelerates. Real wage growth (inflation-adjusted) projected 0-1.5% annually low scenario, 2-3% base case, 3-4% high scenario, with base case carrying ~60% probability based on current policy trajectory and macroeconomic conditions. Specialist electrician premiums (HV authorisations, CompEx, Level 4 Design) projected to widen significantly as infrastructure demand concentrates in data centres and grid upgrades requiring competencies held by only 3-5% of qualified workforce. Employer switching strategy during acute shortage periods 2026-2028 delivers 8-15% increases per move (37-40% total growth switching twice) versus 18-21% internal progression staying single employer (3-4% annually). JIB wage floors provide downside protection during construction downturns while allowing 10-20% market premiums during shortage periods, with catchup lag typically 12-18 months preventing permanent divergence. Regional wage rebalancing projected as Midlands/Northern industrial electrician growth 6-8% annually potentially outpaces London commercial 4-5% due to infrastructure project concentration shifting. Data limitations acknowledged: ONS ASHE excludes self-employed (~30% workforce), contractor day rate advertised vs achieved gaps unknown, macroeconomic forecasts carry ±1-2% uncertainty bands, training pipeline projections depend on policy stability, productivity growth assumptions 1.5-2% subject to technological and regulatory factors. Projections represent evidence-based scenario analysis, not guaranteed outcomes. Next review scheduled following OBR March 2026 forecast, JIB 2026 wage determination, ONS ASHE 2025 release, and Q2 2026 construction output data.
