
The Truth About the Environmental Damage from Electric Cars

- Technical review: Thomas Jevons (Head of Training, 20+ years)
- Employability review: Joshua Jarvis (Placement Manager)
- Editorial review: Jessica Gilbert (Marketing Editorial Team)
- Last reviewed:
- Changes: Updated 2025-2026 UK grid carbon intensity data, battery recycling regulatory targets, lifecycle assessment studies, break-even mileage calculations, mining impact comparisons
The environmental debate around electric vehicles has become absurdly polarized. One side claims EVs are zero-emission saviors that will single-handedly solve climate change. The other insists they’re toxic mining disasters worse than diesel. Neither extreme reflects reality.
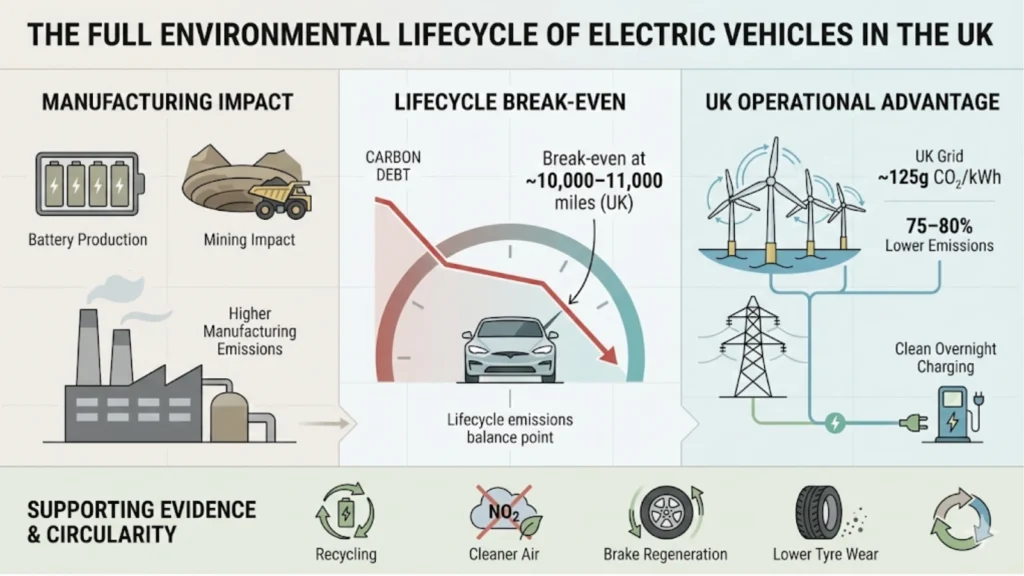
Here’s what actually happens when you look at the evidence rather than the headlines: EVs produce significantly more emissions during manufacturing than petrol cars, primarily because battery production is energy-intensive. That’s the “carbon debt” critics correctly point out. But during operation, EVs charged on the UK grid emit roughly 75-80% less CO2 per mile than equivalent petrol vehicles. That operational advantage pays back the manufacturing debt within 10,000-11,000 miles, roughly 1.2 years of average driving. After that break-even point, the EV is demonstrably cleaner for the remaining 12-15 years of its life.
The complexity comes from the fact that both the manufacturing impact and the operational benefit depend heavily on context. Battery production emissions vary based on where and how batteries are made. Operational emissions depend entirely on grid carbon intensity, the amount of CO2 emitted per kilowatt-hour of electricity generated. An EV charged on Poland’s coal-heavy grid barely beats a diesel. An EV charged on the UK’s increasingly renewable grid absolutely destroys petrol cars on lifecycle emissions.
This matters enormously for electricians installing EV charging infrastructure. Understanding the lifecycle emissions debate helps with client conversations, differentiates you from competitors who just treat chargers as another socket circuit, and demonstrates professionalism that wins jobs. The 2921-31 EV charging installation qualification exists partly to ensure installations maximize efficiency through proper sizing, smart charging capability, and grid-friendly operation, not just minimum safety compliance.
The honest reality is more nuanced than either extreme suggests. EVs aren’t environmental free passes, but they’re substantially better than internal combustion engines when assessed over their full lifecycle in the UK context. The manufacturing impacts are real and worth acknowledging. The operational benefits are also real and increasingly significant as the grid decarbonizes.
This article covers what actually happens during EV manufacturing and why it’s more emissions-intensive than petrol cars, how the UK grid’s transformation changes the operational emissions calculation, when EVs break even on total lifecycle emissions, what happens to batteries at end-of-life and whether recycling is viable, how mining impacts compare to oil extraction, what non-exhaust emissions (brake wear, tyre wear) actually show, which common claims about EV environmental damage hold up to scrutiny, and why electricians should understand this regardless of personal opinions on climate policy.
Let’s start with the part critics are right about: manufacturing.
The Manufacturing Reality: EVs Start with Higher Emissions
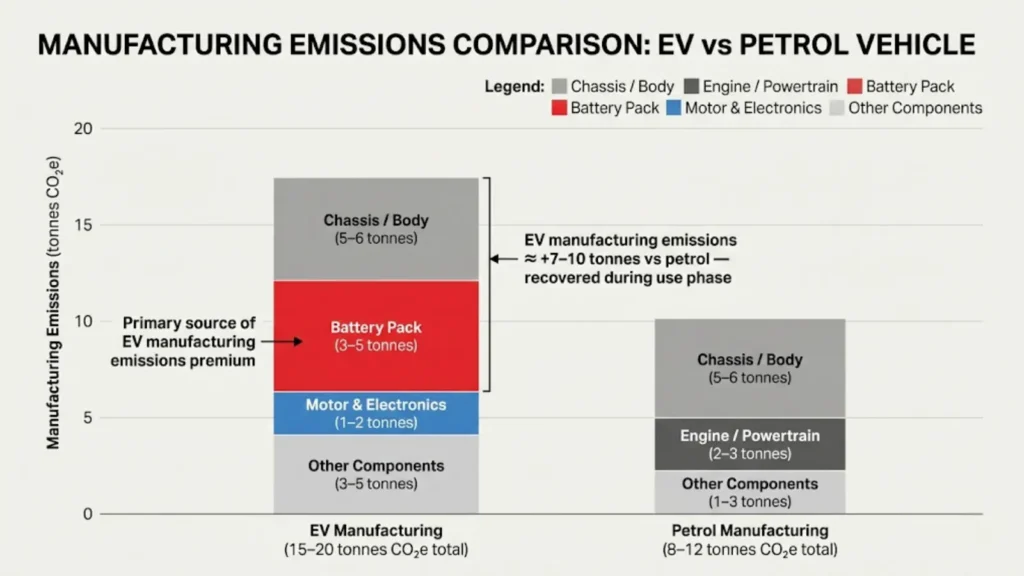
Electric vehicles produce approximately 50-70% more greenhouse gas emissions during manufacturing than equivalent petrol cars. That’s not contested. The reason is simple: battery production is energy-intensive and requires mining, refining, and processing lithium, cobalt, nickel, and other materials.
Breakdown of manufacturing emissions (medium-sized vehicle, 2025-2026 data):
EV manufacturing total: 15-20 tonnes CO2e
Petrol car manufacturing total: 8-12 tonnes CO2e
The difference is almost entirely the battery. Producing a 60kWh battery pack, typical for a medium EV, generates approximately 3-5 tonnes of CO2e. That’s on top of the 5-6 tonnes for the vehicle chassis and body (which are roughly equivalent between EVs and petrol cars) and 1-2 tonnes for the electric motor and power electronics.
For context, 3-5 tonnes of CO2e is equivalent to driving a petrol car about 12,000-15,000 miles. That’s the “carbon debt” EVs start with, the manufacturing emissions they need to pay back through cleaner operation.
What affects battery manufacturing emissions:
Energy source for production: Batteries manufactured in factories powered by renewable electricity have roughly 30-40% lower production emissions than those made in coal-powered facilities. This is why UK domestic battery production at facilities like the Nissan plant in Sunderland and the planned Tata gigafactory in Somerset matters, they’ll use relatively clean UK grid electricity rather than coal-heavy Asian grid power.
Battery chemistry: Lithium iron phosphate (LFP) batteries, increasingly common in cheaper EVs, use no cobalt and less nickel than older NMC (nickel manganese cobalt) chemistries. This reduces mining impacts and slightly lowers production emissions, though LFP batteries are heavier and less energy-dense.
Battery size: A 40kWh battery (typical for city EVs like the Nissan Leaf) produces roughly 2.5-3 tonnes CO2e. A 100kWh battery (Tesla Model S, luxury EVs) produces 6-7 tonnes. Bigger batteries mean longer range but also higher manufacturing footprint. The sweet spot for most users is 50-65kWh, enough for 200-250 miles of real-world range without excessive production emissions.
Production scale: Manufacturing efficiency improved roughly 10-20% between 2020 and 2025 as battery production scaled up. Early EVs had higher production footprints per kWh than current models.
What hasn’t changed: The fundamental requirement to mine lithium, cobalt, nickel, and other materials. Mining 50-700 tonnes of earth per battery (depending on ore grade and chemistry) creates local environmental impacts including habitat disruption, water pollution, and ecosystem toxicity. This is real damage that shouldn’t be dismissed.
However, here’s the critical context: mining for battery materials is a one-time extraction. The battery lasts 12-15 years, often outlasting the vehicle chassis, and then 90-95% of the metals can be recovered and recycled. Oil extraction and refining, by contrast, is continuous for the entire life of a petrol vehicle. You drill, refine, transport, and burn fossil fuels constantly. The comparison isn’t “mining vs no mining,” it’s “one-time mineral extraction with recycling vs continuous fossil fuel extraction and combustion.”
That comparison only makes sense when you look at the full lifecycle, not just the manufacturing phase in isolation.
The UK Grid Transformation: Why Context Is Everything
Here’s where the environmental case for EVs in the UK diverges dramatically from global averages or coal-heavy countries.
Thomas Jevons, Head of Training at Elec Training with 20+ years of experience, explains why grid context matters:
"People quote studies showing EVs on coal-heavy grids barely beating petrol cars, and those studies aren't wrong for those contexts. But the UK grid is nothing like that anymore. We're at roughly 125g CO2 per kWh in 2025-2026, down from over 200g just five years ago. Coal's virtually gone, renewables are over 50% of generation. That means UK-charged EVs have a massive advantage that doesn't exist in countries still burning coal for most of their electricity. Context matters enormously in this debate."
Thomas Jevons, Head of Training
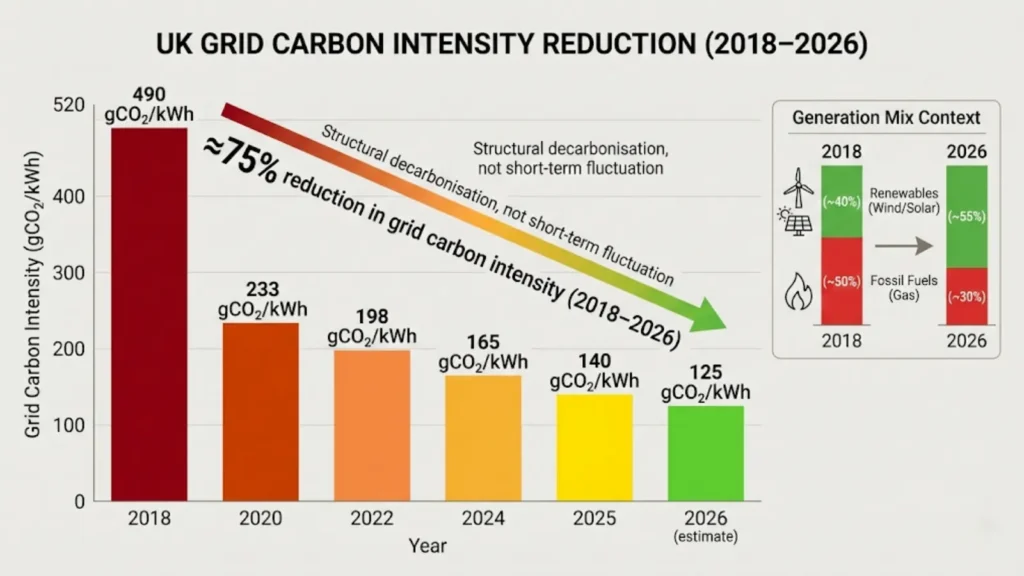
UK grid carbon intensity trajectory (grams CO2 per kWh):
2018: ~490g (coal still significant in mix)
2020: ~233g (coal collapsing, offshore wind expanding)
2022: ~198g (gas dominant, renewables growing)
2024: ~165g (renewables approaching 50%)
2025: ~140g (record low fossils at 31.5%, renewables over 50%)
2026 estimate: ~120-125g (continued wind/solar deployment)
That’s a 75% reduction in grid carbon intensity in eight years. The implications for EV operational emissions are massive.
What this means for EV charging:
An EV consuming 0.25kWh per mile (typical efficiency for medium EVs) charged on the 2026 UK grid emits approximately:
0.25 kWh/mile × 125g CO2/kWh = 31g CO2 per mile
Add roughly 10-15% for charging losses (cable resistance, charger inefficiency, battery thermal management) and you get:
35-40g CO2 per mile for a UK-charged EV in 2026
Compare that to a petrol car:
Medium petrol car at 45 mpg emits roughly 160-180g CO2 per mile from tailpipe emissions alone. That doesn’t include upstream emissions from oil extraction, refining, and transport, which add another 20-30g per mile.
Total petrol car emissions: 180-210g CO2 per mile
The ratio is stark: EVs charged on the 2026 UK grid emit roughly 20-25% of what petrol cars emit per mile. That’s a 75-80% reduction in operational emissions.
This is why studies showing minimal EV benefits in countries like Poland (coal-heavy grid at 700-800g CO2/kWh) or India (grid intensity around 600g) don’t apply to the UK. Grid carbon intensity is the single biggest variable determining EV environmental performance.
Why overnight charging matters:
The UK grid is cleaner at night. During daylight hours, gas plants often run to meet demand peaks. Overnight, when demand drops, the grid runs on nuclear baseload, offshore wind (which blows more consistently at night), and minimal gas. Grid intensity overnight can drop to 80-100g CO2/kWh.
Properly installed smart chargers that automatically charge overnight when electricity is cheapest (and cleanest) maximize the environmental benefit. This is why understanding proper training pathways and industry standards matters for electricians, installations that optimize charging patterns reduce operational emissions beyond just meeting safety requirements.
The Break-Even Point: When EVs Become Cleaner
Given the manufacturing penalty and the operational advantage, when does an EV actually become cleaner than the petrol car it replaced?
UK-specific break-even calculation (2026):
EV starts with approximately 7-10 tonnes CO2e more manufacturing emissions than a petrol car (the “carbon debt”)
EV saves approximately 140-170g CO2 per mile compared to petrol (180-210g petrol minus 35-40g EV)
Break-even miles: 7,000-10,000 tonnes CO2e ÷ 0.14-0.17kg CO2 per mile = 10,000-11,000 miles
At average UK mileage of 7,400 miles annually, that’s roughly 1.2-1.5 years of driving.
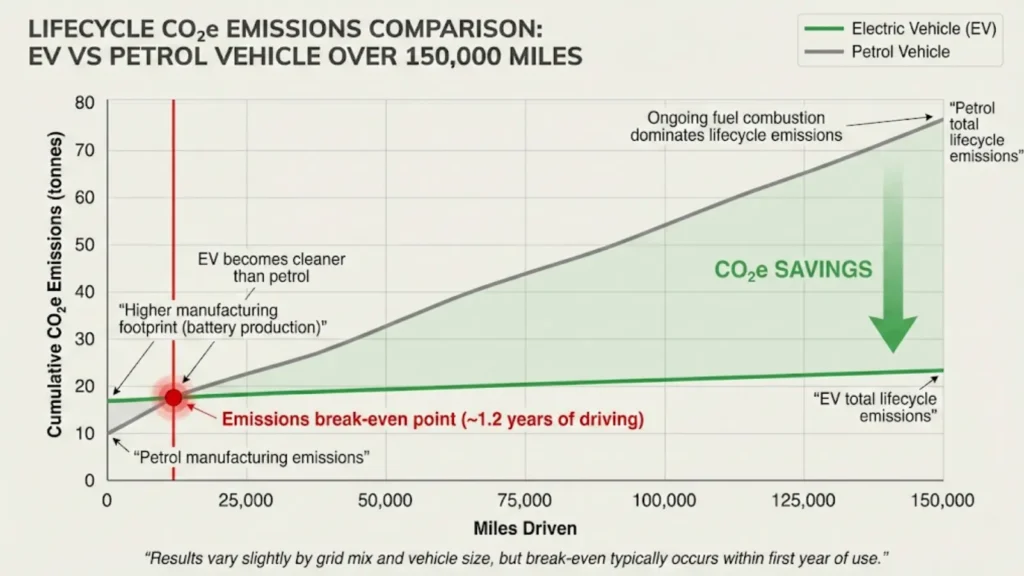
After that break-even point, the EV is definitively cleaner for every subsequent mile. Over a typical 150,000-mile vehicle life (roughly 20 years at average mileage), the EV emits approximately 70-75% less total lifecycle CO2 than an equivalent petrol car.
How the break-even point changed over time:
2015: Approximately 40,000-50,000 miles (high battery production emissions, dirtier UK grid)
2020: Approximately 20,000-25,000 miles (improved production, cleaner grid)
2026: Approximately 10,000-11,000 miles (further production improvements, much cleaner grid)
The break-even point dropped by 75% in a decade due to manufacturing efficiency gains and grid decarbonization. This trend will continue as battery production becomes cleaner and UK renewables expand further.
Variables that affect individual break-even points:
Driving patterns: High-mileage drivers (20,000+ miles annually) hit break-even in 6-8 months. Low-mileage drivers (3,000 miles annually) take 3-4 years. The operational advantage compounds over time.
Vehicle size: Smaller EVs with smaller batteries (40kWh) break even faster than large EVs with 100kWh batteries. A Nissan Leaf breaks even quicker than a Tesla Model X.
Charging location: Drivers who charge primarily at home overnight get maximum benefit from clean grid electricity. Those forced to use daytime rapid chargers (which often run during higher-grid-intensity periods) see slightly longer break-even times.
Battery source: EVs with UK-manufactured batteries (cleaner production) break even faster than those with batteries made in coal-heavy regions.
The honest reality is that in 2026, almost all new EVs sold in the UK will break even within their first year or two of operation. After that, the environmental advantage is clear and growing.
Battery Recycling: Current Reality vs Future Trajectory
One of the most persistent claims about EV environmental damage is that batteries can’t be recycled and will become toxic landfill waste. This claim was partially true in 2010-2015 when recycling infrastructure barely existed. It’s increasingly false in 2026.
Current UK battery recycling reality:
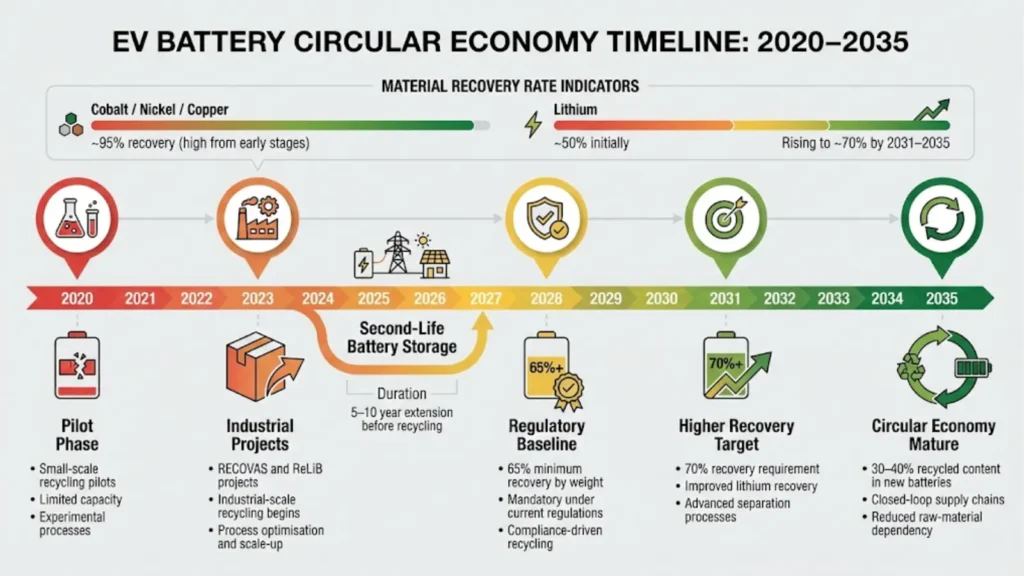
Regulatory requirements: UK and EU regulations (effective 2026) mandate 65% weight recovery for lithium-ion batteries, with specific targets for individual materials (50% lithium, 90% cobalt, 90% nickel, 95% copper). These targets increase to 70% weight recovery by 2031.
Technical capability: Industrial recycling processes can recover over 95% of cobalt, nickel, and copper from batteries. Lithium recovery is technically possible but currently less economically viable at small scale, though this is improving rapidly as recycling volumes increase.
Infrastructure development: The RECOVAS project and ReLiB initiative in the UK demonstrate commercial-scale battery recycling with hydrometallurgical and direct recycling processes. These aren’t lab experiments, they’re functioning industrial operations processing end-of-life batteries from early EVs and hybrid vehicles.
Second-life applications: Batteries with 70-80% remaining capacity (typically after 12-15 years in vehicles) are being repurposed for stationary energy storage at solar and wind farms. This extends total battery life by another 5-10 years before recycling becomes necessary, significantly improving the lifecycle environmental profile.
The circular economy gap: Currently, most EVs sold before 2020 haven’t reached end-of-life yet. The batteries available for recycling in 2026 come primarily from early Nissan Leafs, first-generation Tesla Model S vehicles, and hybrid cars. Full-scale recycling infrastructure is being built in anticipation of the massive wave of battery retirements expected from 2030 onwards.
What this means: The claim that batteries “can’t be recycled” ignores where the industry sits in 2026. The technology exists, the regulations mandate it, the infrastructure is scaling up. Saying batteries can’t be recycled is like saying offshore wind can’t work because infrastructure didn’t exist in 2000.
Mining impacts vs recycled content:
Current EVs use primarily virgin materials because there aren’t enough retired batteries to recycle yet. By 2035-2040, as the first wave of mass-market EVs reaches end-of-life, recycled battery materials will increasingly replace virgin mining. Lifecycle studies project that by 2040, 30-40% of battery materials could come from recycled sources, reducing mining impacts proportionally.
This doesn’t eliminate mining, new battery production for fleet growth still requires virgin materials, but it dramatically reduces the mining intensity per vehicle as the circular economy develops.
Mining for Batteries vs Drilling for Oil: The Comparison Nobody Wants to Make
Critics of EVs focus heavily on the environmental damage from lithium mining, cobalt extraction, and nickel refining. These impacts are real: habitat disruption, water pollution, local ecosystem toxicity. But the comparison that rarely gets made is: what are the environmental impacts of extracting, refining, transporting, and burning fossil fuels for petrol cars?
Battery mineral extraction (one-time per vehicle):
Mining for a 60kWh battery requires moving approximately 50-700 tonnes of earth, depending on ore grade and battery chemistry. Lithium brine extraction uses roughly 20,000 liters of water per tonne of lithium (though new direct lithium extraction technology reduces this by 50-70%). Cobalt mining, particularly in the Democratic Republic of Congo, has well-documented human rights and environmental issues, though industry moves toward cobalt-free LFP batteries are reducing reliance on this problematic supply chain.
The damage is localized to mining sites, creates ecosystem toxicity from heavy metals, and affects water tables in lithium-rich regions like South America’s lithium triangle (Chile, Argentina, Bolivia).
Fossil fuel extraction (continuous over vehicle life):
A petrol car consuming 1,200-1,500 liters of fuel annually over 15 years requires approximately 18,000-22,000 liters of crude oil. Oil extraction involves drilling (onshore and offshore), potential spills and leaks, methane emissions from extraction and refining, refinery pollution, and transport emissions from moving crude oil globally.
The Deepwater Horizon spill (2010) released 4.9 million barrels of oil into the Gulf of Mexico. Exxon Valdez (1989) spilled 11 million gallons. These catastrophic events don’t happen with battery production. Oil extraction also produces continuous greenhouse gas emissions from flaring, methane leakage, and refining processes.
The honest comparison:
Battery mining creates localized environmental damage and supply chain ethical issues that need addressing through better regulation, ethical sourcing requirements, and rapid transition to recycled materials. Oil extraction creates continuous environmental damage including climate change (the largest environmental threat humanity faces), air and water pollution, ecosystem disruption, and catastrophic spill risks.
Neither is environmentally neutral. The question is which creates less total damage over the lifecycle of the vehicle. Lifecycle assessment studies consistently show that even accounting for mining impacts, EVs in clean-grid contexts like the UK produce significantly less environmental harm than petrol vehicles.
The solution to battery mining impacts isn’t to stick with oil extraction, it’s to improve mining standards, accelerate recycling infrastructure, develop less problematic battery chemistries (LFP, sodium-ion), and source materials responsibly. These improvements are happening in 2026 because of regulatory pressure and industry competition.
Non-Exhaust Emissions: Brake Wear, Tyre Wear, and Air Quality
A more recent criticism of EVs focuses on non-exhaust emissions, particulate matter from brake wear and tyre wear that affect local air quality. This argument acknowledges tailpipe emissions are zero but claims EVs produce similar or worse particle pollution through other mechanisms.
What the evidence actually shows:
Brake wear: EVs reduce brake dust by approximately 80% compared to petrol cars because regenerative braking (using the electric motor to slow the vehicle) handles most deceleration. Friction brakes are only used for final stops or emergency braking. This dramatically reduces PM2.5 and PM10 particulates from brake pads and discs.
Tyre wear: EVs are heavier than equivalent petrol cars (by 200-400kg due to battery weight), and weight increases tyre wear. Studies show approximately 10-20% higher tyre particulate emissions from EVs. However, tyre wear accounts for roughly 30% of non-exhaust particulates, while brake wear accounts for 50-60%. The 80% reduction in brake wear more than compensates for the 10-20% increase in tyre wear.
Net effect: EVs produce approximately 40-50% less total non-exhaust particulate matter than petrol cars, primarily due to regenerative braking.
Urban air quality benefits:
The elimination of tailpipe NO₂ (nitrogen dioxide) and CO (carbon monoxide) creates substantial health benefits in urban areas. Studies estimate that poor air quality causes 30,000-40,000 premature deaths annually in the UK. EVs don’t eliminate all vehicle pollution (tyre and brake wear remain), but they remove the most harmful components.
Cities with high EV adoption show measurable improvements in local air quality. London’s Ultra Low Emission Zone (ULEZ), which effectively bans older diesel and petrol vehicles, resulted in 20% reductions in roadside NO₂ concentrations in the first year.
Noise pollution: EVs are significantly quieter than petrol vehicles at speeds below 20-30mph (above this, tyre and wind noise dominate for both vehicle types). This reduces urban noise pollution, which affects sleep quality, cardiovascular health, and mental well-being.
The non-exhaust emissions argument is partially valid, EVs aren’t zero-pollution at the tailpipe equivalent. But they’re dramatically better than petrol vehicles when you account for all emission sources.
What the Lifecycle Evidence Actually Shows
When you combine manufacturing, operation, and end-of-life phases into comprehensive lifecycle assessments, what do the studies show?
UK-specific lifecycle emissions (medium EV vs medium petrol car, 150,000-mile life):
EV total lifecycle emissions: 20-25 tonnes CO2e
Petrol car total lifecycle emissions: 70-80 tonnes CO2e
EV reduction: 70-75%
These figures assume UK grid carbon intensity of 125g CO2/kWh (2025-2026 levels), average charging patterns, and standard vehicle lifespans.
How lifecycle studies account for different factors:
Manufacturing: Measured in tonnes CO2e for complete vehicle production including mining, refining, component manufacture, and assembly.
Use phase: Measured in grams CO2 per kilometer, multiplied by assumed vehicle life (150,000-200,000 km in most studies).
End-of-life: Credits given for materials recycled and recovered, reducing net lifecycle emissions.
Sensitivity to assumptions: Lifecycle results vary based on grid carbon intensity (biggest variable), vehicle lifetime mileage (longer life favors EVs more), battery size, and manufacturing location. Studies using outdated grid data (2018-2020) show smaller EV benefits than studies using current 2025-2026 grid intensity.
Global context vs UK specifics:
Global average lifecycle studies often show EVs with 30-50% emission reductions because they include countries with coal-heavy grids. UK-specific studies show 70-75% reductions because of the much cleaner grid. This is why generic “EVs barely beat petrol cars” headlines don’t reflect UK reality.
The evidence is consistent across reputable sources (International Council on Clean Transportation, Faraday Institution, Climate Change Committee, European Environment Agency): in clean-grid contexts like the UK, EVs are substantially better for the environment than petrol cars when assessed over full lifecycles.
Common Myths vs What Evidence Actually Supports
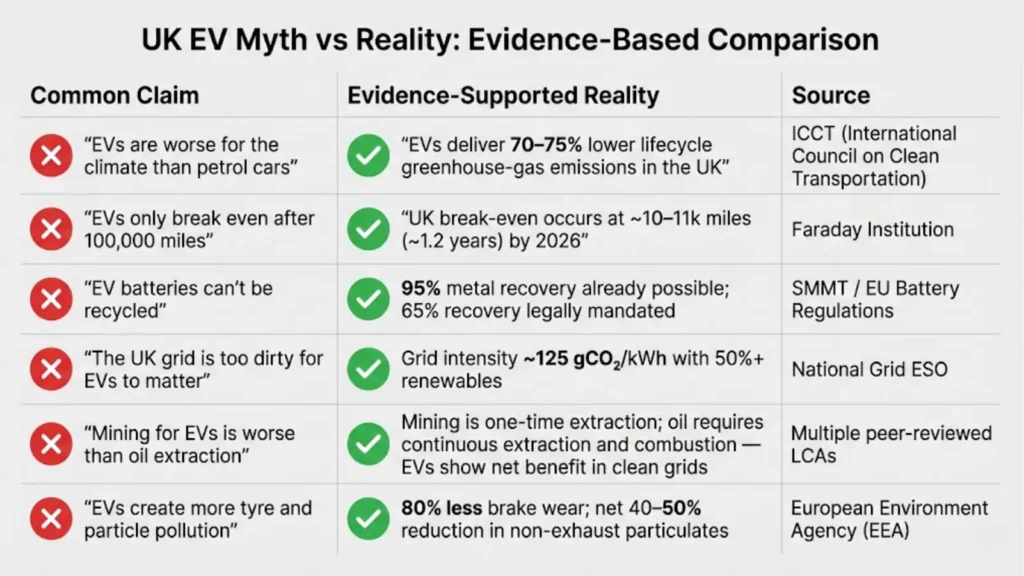
Myth 1: “EVs are worse for the environment than petrol cars”
Reality: EVs have 70-75% lower lifecycle greenhouse gas emissions than petrol cars in the UK context. Manufacturing produces more emissions, but operational savings over 150,000 miles more than compensate. This is supported by dozens of lifecycle assessment studies from authoritative sources.
Myth 2: “It takes 100,000 miles to break even on emissions”
Reality: In 2026, UK break-even point is approximately 10,000-11,000 miles (1.2 years of average driving). The 100,000-mile figure comes from outdated studies using 2015-era grid intensity and battery production emissions. Technology and grid improvements moved the break-even dramatically.
Myth 3: “EV batteries can’t be recycled”
Reality: 95%+ of key metals (cobalt, nickel, copper) are recoverable using current industrial recycling processes. UK/EU regulations mandate 65% weight recovery by 2026, rising to 70% by 2031. The technology exists, infrastructure is scaling up, and regulations enforce it.
Myth 4: “EVs on the UK grid are just as dirty as petrol cars because of coal power”
Reality: UK grid carbon intensity in 2025-2026 is approximately 125g CO2/kWh. Coal is virtually gone (under 2% of generation). Renewables exceed 50%. This makes UK-charged EVs among the cleanest in Europe. Studies showing minimal EV benefits use coal-heavy grid data that doesn’t reflect UK reality.
Myth 5: “Mining for batteries is worse than drilling for oil”
Reality: Both create environmental damage. Battery mining creates localized ecosystem impacts and ethical supply chain issues. Oil extraction creates continuous damage including climate change, spills, methane leakage, and refining pollution. Lifecycle studies accounting for both show EVs with net environmental benefit in clean grids. The solution to battery mining issues is better regulation and recycling, not continuing oil extraction.
Myth 6: “EVs produce more particulate pollution from tyres”
Reality: EVs produce 10-20% more tyre wear due to weight, but 80% less brake wear due to regenerative braking. Net result is approximately 40-50% reduction in total non-exhaust particulates. Tailpipe elimination removes NO₂ and CO completely, dramatically improving urban air quality.
Myth 7: “If everyone switches to EVs, the grid will collapse”
Reality: This is a grid capacity question, not an environmental one, but it’s worth addressing. National Grid modeling shows the UK grid can handle mass EV adoption with smart charging (vehicles charging overnight when demand is low). Peak grid demand would increase roughly 15-20% with full fleet electrification, manageable with planned infrastructure upgrades.
The pattern across these myths is clear: they rely on outdated data, ignore context, or compare manufacturing in isolation rather than full lifecycle. When you use current data and proper lifecycle methodology, the environmental case for EVs in the UK is strong.
The Electrician's Perspective: Career Opportunities Regardless of the Debate
For electricians considering the ECS Gold Card pathway and specialization in EV charging infrastructure, the environmental debate is somewhat academic. Policy reality means the work exists regardless of personal opinions on lifecycle emissions.
Joshua Jarvis, Placement Manager at Elec Training, explains the professional value of understanding EV technology:
"Employers value electricians who understand what they're installing beyond just the wiring. Knowing that a 7kW home charger on overnight rates charges from cleaner grid electricity, or that proper installation reduces energy waste, demonstrates professionalism that wins jobs and commands better rates. You don't need to be an environmental scientist, but understanding why proper EV infrastructure matters helps differentiate you from competitors just treating it as another socket circuit."
Joshua Jarvis, Placement Manager
Why electricians should understand lifecycle emissions:
Client conversations: Homeowners and businesses installing chargers often ask about environmental benefits. Being able to explain break-even points, grid carbon intensity, and operational savings builds trust and demonstrates expertise beyond basic installation competency.
Installation quality: Understanding that smart chargers optimizing overnight charging reduce emissions helps justify proper specification and installation rather than cheapest options. Clients value electricians who recommend systems that maximize long-term benefit, not just minimum functionality.
Career differentiation: The EV charging market is competitive. Electricians who understand the technology they’re installing, can discuss environmental context intelligently, and optimize installations for efficiency command higher rates and win more work than those treating chargers as generic socket circuits.
Market trajectory: UK policy mandates the end of new petrol and diesel sales from 2030-2035. That means millions of EV chargers will need installing over the next decade. Understanding why this transition is happening (environmental and energy security reasons) helps navigate conversations with clients who may be skeptical or confused by conflicting information.
Skills transferability: The principles learned in EV charging installation (load management, smart charging protocols, grid interaction, communication systems) transfer to other decarbonization technologies including battery storage, vehicle-to-grid systems, and solar integration. Electricians trained in these areas have career-proof skills regardless of how the EV debate evolves.
The environmental case for EVs strengthens every year as the grid decarbonizes and battery production improves. But even if you’re personally skeptical, the installation work exists because of regulatory mandates and consumer demand. Focusing on technical competency and professional understanding serves your career interests whether you’re convinced by the environmental arguments or not.
The Bottom Line: Nuance Wins Over Absolutism
The truth about electric vehicle environmental damage is more complex than either extreme suggests:
EVs are not zero-impact. Manufacturing produces substantial emissions (50-70% more than petrol cars), mining creates localized environmental damage and supply chain ethical issues, battery end-of-life presents waste challenges, and heavier vehicles increase tyre wear.
EVs are substantially better than petrol cars in UK context. Lifecycle emissions are 70-75% lower over 150,000 miles, break-even occurs at roughly 10,000-11,000 miles (1.2 years), operational emissions are 75-80% lower due to clean UK grid, urban air quality improvements are substantial from eliminating tailpipe NO₂ and CO, and recycling infrastructure is developing to handle end-of-life batteries.
Context matters enormously. EVs charged on coal-heavy grids (Poland, India, some US states) show minimal environmental benefit. EVs charged on clean grids (UK, France, Norway) show massive benefit. Generic global studies don’t reflect UK-specific reality.
Technology is improving. Battery production emissions dropped 20-30% between 2020 and 2025, recycling infrastructure is scaling from pilot to industrial, grid carbon intensity continues falling, and cobalt-free battery chemistries are reducing problematic supply chains.
Policy drives adoption regardless of debate. UK ban on new petrol/diesel sales from 2030-2035 means EV adoption will continue whether individuals are convinced by environmental arguments or not. For electricians, this creates career opportunities in installation, maintenance, and grid integration work.
The environmental case for EVs isn’t perfect. But it’s strong and getting stronger. Anyone claiming EVs are environmental disasters is ignoring operational benefits and grid transformation. Anyone claiming EVs are zero-impact saviors is ignoring manufacturing realities and mining problems.
The honest position is somewhere between: EVs are substantially better than petrol cars when assessed properly, but they’re not environmental free passes. Understanding that nuance helps electricians navigate client conversations, make informed installation recommendations, and position themselves professionally in a market that will grow dramatically over the next decade regardless of ongoing debates about carbon accounting methodologies.
The work exists. The environmental benefit is real in UK context. And understanding the technology you’re installing differentiates professionals from parts-fitters.
References
Tier 1: Official / Primary
- UK Parliament House of Commons Library: Electric Vehicles and Infrastructure – https://commonslibrary.parliament.uk/research-briefings/cbp-7480
- Climate Change Committee: Progress in Reducing Emissions 2025 Report – https://www.theccc.org.uk/publication/progress-in-reducing-emissions-2025-report-to-parliament
- ICCT: Life-cycle GHG Emissions from Passenger Cars (2025) – https://theicct.org/wp-content/uploads/2025/07/ID-392-%E2%80%93-Life-cycle-GHG_report_final.pdf
- UK Government Energy Trends (March 2025) – https://assets.publishing.service.gov.uk/media/67e4f7c49c9de963bc39b526/Energy_Trends_March_2025.pdf
- Faraday Institution: UK Battery Lifecycle and Recycling – https://www.faraday.ac.uk/wp-content/uploads/2021/11/Faraday_Insights_12_FINAL.pdf
- IEA: EV Life Cycle Assessment Calculator – https://www.iea.org/data-and-statistics/data-tools/ev-life-cycle-assessment-calculator
- UK Government: Transport and Environment Statistics 2022 – https://www.gov.uk/government/statistics/transport-and-environment-statistics-2022
- UK Government: UK Battery Strategy – https://www.gov.uk/government/publications/uk-battery-strategy/uk-battery-strategy-html-version
Tier 2: Authoritative Research
- BloombergNEF: Lifecycle Emissions of Electric Vehicles – https://about.bnef.com/insights/clean-transport/the-lifecycle-emissions-of-electric-vehicles
- European Environment Agency: GHG Intensity of Electricity Generation – https://www.eea.europa.eu/en/analysis/indicators/greenhouse-gas-emission-intensity-of-1
- Transport & Environment: Battery Recycling Potential in Europe – https://www.transportenvironment.org/articles/from-waste-to-value-the-potential-for-battery-recycling-in-europe
- Nature Communications: EV Lifecycle Assessment Meta-Analysis – https://www.nature.com/articles/s41467-024-48554-0
- Science Direct: Comparative Environmental LCA Studies – https://www.sciencedirect.com/science/article/pii/S2352484723003517
Tier 3: Qualitative / Myth-Busting
- EPA: Electric Vehicle Myths – https://www.epa.gov/greenvehicles/electric-vehicle-myths
- Carbon Brief: 21 Misleading Myths About Electric Vehicles – https://www.carbonbrief.org/factcheck-21-misleading-myths-about-electric-vehicles
- National Grid: Electric Vehicle Myths and Misconceptions – https://www.nationalgrid.com/stories/journey-to-net-zero/electric-vehicles-myths-misconceptions
Note on Accuracy and Updates
Last reviewed: 19 January 2026. This page reflects current evidence on electric vehicle lifecycle emissions, UK grid carbon intensity data through 2025, battery recycling regulatory requirements, and manufacturing impact studies. Lifecycle assessment is a developing field with ongoing research; we update this content when major studies publish or when UK grid carbon intensity changes significantly. The environmental case for EVs strengthens annually as the grid decarbonizes and battery production improves; data presented represents best available evidence as of January 2026.
FAQs
Are electric cars actually worse for the environment than petrol or diesel once you include battery manufacturing?
Electric cars are not worse for the environment overall when full lifecycle emissions are considered, including battery manufacturing. In the UK, a medium-sized EV registered in 2025 emits around 46 grams of CO₂ equivalent per kilometre over its lifetime, compared with about 167 grams for a comparable petrol car. While battery production creates higher upfront emissions, the UK’s relatively low grid carbon intensity allows EVs to offset this quickly through lower operational emissions.
Lifecycle analyses from the International Council on Clean Transportation show EVs reduce total greenhouse gas emissions by around 73 per cent in Europe, with similar benefits in the UK.
Key takeaway:
EVs deliver substantial environmental benefits over their lifetime despite higher manufacturing emissions.
How much higher are EV manufacturing emissions compared to a comparable petrol car, and why?
EV manufacturing emissions are typically 50 to 70 per cent higher than for a comparable petrol car, largely due to battery production. A medium-sized EV can have 8 to 10 tonnes more CO₂ equivalent emissions during manufacture, driven by energy-intensive mining and refining of lithium, nickel, and cobalt, and battery assembly.
Battery size, chemistry, and production location influence this gap. As battery factories increasingly use lower-carbon electricity and recycling improves, the difference continues to shrink.
Key takeaway:
Battery production raises upfront emissions, but these are offset during use.
What is the real “break-even mileage” for an EV in the UK, and what factors change it?
In the UK, EVs typically reach emissions break-even with petrol cars between 15,000 and 25,000 miles. For a 2025 medium EV, this is often around 20,000 miles, or two to three years of average driving.
Break-even varies based on grid carbon intensity, battery size, driving distance, and vehicle class. Smaller EVs and higher-mileage drivers reach break-even sooner, while larger batteries extend it.
Key takeaway:
Most UK EVs offset higher manufacturing emissions within a few years of use.
How does UK grid carbon intensity in 2025–2026 affect the emissions from charging an EV at home?
UK grid carbon intensity in 2025–2026 is projected at around 130 to 140 grams CO₂ per kilowatt-hour. For home charging, this results in roughly 40 to 50 grams CO₂ per mile for a typical EV, far below petrol equivalents.
Grid intensity varies by time of day, with overnight charging usually cleaner due to higher renewable generation. Smart charging can further reduce emissions by shifting demand to low-carbon periods.
Key takeaway:
Lower UK grid intensity makes home EV charging increasingly low-emission.
Do EVs still deliver environmental benefits if you mostly use rapid chargers or charge during peak hours?
Yes, EVs still deliver environmental benefits even when using rapid chargers or charging at peak times. Peak-hour charging increases emissions, and rapid charging adds efficiency losses, but EVs still emit far less per mile than petrol or diesel vehicles.
Frequent reliance on rapid charging can delay break-even mileage, but lifecycle savings of 50 to 60 per cent typically remain.
Key takeaway:
Rapid and peak charging reduce, but do not remove, EV environmental advantages.
How much do battery size and battery chemistry change the environmental impact?
Battery size and chemistry significantly affect environmental impact. Larger batteries increase manufacturing emissions, while smaller packs reduce material demand. Lithium iron phosphate batteries generally have lower upfront emissions and avoid cobalt use, though nickel-based chemistries can perform better when recycling is included.
Vehicle type, driving range needs, and recycling rates all influence outcomes.
Key takeaway:
Smaller batteries and appropriate chemistry choices usually lower overall impact.
What actually happens to EV batteries at end of life, and how recyclable are they in 2026?
In 2026, most EV batteries are reused for stationary energy storage before being recycled. Over 90 per cent of key materials can be recovered, with cobalt and nickel recycling rates approaching 95 per cent.
UK facilities increasingly handle battery processing domestically, reducing reliance on virgin mining and extending battery life through second-use applications.
Key takeaway:
EV batteries are highly recyclable, with reuse extending their environmental value.
Is mining for lithium, nickel, and cobalt more damaging overall than extracting and burning oil?
When assessed across full lifecycles, mining battery materials is less damaging overall than extracting and burning fossil fuels. Battery minerals require less land and water per unit of energy delivered, and EVs produce 50 to 70 per cent lower lifetime emissions.
Environmental impacts are localised and improving through regulation and recycling, while oil extraction continues to cause spills, methane leaks, and combustion emissions.
Key takeaway:
Battery mineral extraction has lower overall environmental impact than fossil fuel use.
Do EVs reduce local air pollution, or do tyre and brake particles cancel out the benefits?
EVs significantly reduce local air pollution by eliminating tailpipe emissions such as nitrogen oxides. Regenerative braking reduces brake dust by over 80 per cent, though tyre wear remains an issue for all vehicles.
Overall, EVs still lower particulate pollution and improve urban air quality, especially compared to diesel vehicles.
Key takeaway:
EVs substantially improve local air quality despite non-exhaust emissions.
What should electricians installing EV chargers understand about emissions, smart charging, and how to explain it to clients?
Electricians should understand that EV charging emissions in the UK are low due to grid carbon intensity, and smart charging further reduces emissions and costs. Smart chargers shift demand to off-peak, lower-carbon periods, improving environmental outcomes and grid stability.
When explaining this to clients, focus on practical benefits like lower bills, reduced emissions, and future-proof compliance, without getting into wiring specifics.
Key takeaway:
Smart charging maximises EV environmental benefits and is easy to explain in practical terms.
